Interesting news from the Tampa Bay Times:
According to Stephen Nohlgren, the Rays will increase the pay of nearly 500 part-time workers to $10 an hour. This is an average increase of $1.75 per hour per employee.
With many other companies in the Tampa Bay area increasing their minimum wage, this is good for the Rays. It is a low cost effort, gives good public relations, and you never want to be the last company doing something like this.
But how much will they be spending total?
Of course, the amount of hours worked will vary on how many games are played that week or how long the games go. But let's assume the average employee works 35 hours a week.
35 hours x $10 = $350/week
Baseball season is approximately 24 weeks.
$350/week x 24 weeks = $8,400 per season per employee
$8,400 x 500 employees = $4,200,000
Or $200,000 more than the Rays are paying Alex Cobb this season.
How much more are the Rays spending on employees by raising their minimum wage?
35 hours x $1.75 per hour = $61.25/week
$61.25 x 24 weeks = $1,470
$1470 x 500 employees = $735,000
Or $220,000 more than the Rays are paying Jake Odorizzi.
No one will be rich working for minimum wage for the Tampa Bay Rays. But raising their bottom wage level is a good move for the team. Especially when player payroll was lowered over $12 million (or 15.6%) over the offseason. Now the Rays can say some of that (approximately 6%) went back into the pockets of the workers.
Saturday, February 28, 2015
Sunday, February 22, 2015
Guest Post: Modeling Rays' Attendance: A Restricted Model
(This is our first guest post. We would like to welcome Josh Simmons, a Masters Student at the University of South Florida studying Economics. Josh contacted me and offered to do some statistical modeling on Rays attendance. Since I am far from an expert on that level of research, I gladly accepted.)
Do you remember when everyone thought that the (Devil) Rays’ attendance problems would disappear when the team started winning? It’s been shown over and over again that attendance is correlated with winning, so the Rays shouldn’t be any different, right? Well, the team is winning (and has been for most of the last seven years) and the Rays are continually close to the bottom of the league in overall attendance. So, if Tampa Bay residents don’t care about a winning team, what do they care about? What draws them to a game?
I. Literature
There are numerous studies that aim to answer just that question, for both major and minor league baseball. The papers that most closely resemble this one include Siegfried and Eisenberg (1980), Paul, Toma, and Weinbach (2009) and McDonald and Rascher (2000), although there are some obvious differences in the way the studies are constructed. One of the major differences between all of the major journal articles that I’ve come across and this post is that they all focus on an entire league, be it major or minor, while I have chosen to study just the Rays organization. It will be interesting to see if conclusions that are common to each study hold when examining just the Rays. In other words: Does the demand for Rays’ baseball mirror the demand for baseball across the rest of the major league, or is there something unique about the Rays’ organization and/or Tampa Bay?
Within the literature (and this post) you can combine the independent variables used in the statistical models into groups. One group could be temporal variables such as start time of the game, day of the week, month, and year. Next, you could combine demographic variables (which I don’t include in my model because I’m focusing on just one team) controlling for population, income, race, etc. for a certain region surrounding the team(s). Another group would consist of promotions (either differentiated into different categories or aggregated), the opponent, and starting pitcher(s). Lastly, I would group performance variables together, these include win percentage for each game (or for the year, if studying attendance in the aggregate and not on a game-by-game basis), net total runs (to capture the relative excitement of a team’s games), pitcher’s respective records, and whether or not the team is in playoff contention or not (I only include win percentage in this analysis, but will explore others later). This list is not exhaustive and you could, if desired, break certain variables into pieces to study a certain topic of interest.
For the temporal variables, Lemke, Leonard and Tlhokwane (2010) found at the major league level, Monday through Friday games draw fewer fans than Saturday and Sunday afternoon games. Games played in April, May, and September are expected to draw worse than games played in July or August. At the minor league level, Paul, Paul, Toma and Brennan (2007) found that Tuesday, Thursday, and Friday all drew better than the omitted Wednesday variable, while Monday (and curiously enough) Saturday and Sunday didn’t have a significant difference in attendance than, again, a game played on Wednesday.
Lemke, Leonard and Tlhokwane (2010) determined that, again at the major league level, whether or not a promotion or giveaway occurred during a game does have a positive and significant effect on attendance. McDonald and Rascher (2000) and Hill, Madura and Zuber (1982) came to the same conclusion.
As for performance variables, I have included only Win Percentage (WINPCT). Hill, Madura, and Zuber (1982), Rascher (1996), Bruggink and Eaton (1996), McDonald and Rascher (2000), and Coates and Harrison (2005) all found that a higher win percentage led to an increase in attendance at the major league level.
II. The Model
I will balance being thorough in my reporting of the statistical model, while also realizing that some (if not most) might not have much experience interpreting the results. So, if something sounds complicated, just keep reading - I will reword it. On the other hand, if you do have a background in quantitative analysis, please, try to stay patient as I try to make things easy to understand.
(For help interpreting SPSS regression results, I suggest reading this. If you need to brush up on dummy variables, try this.)
I am using OLS as my regression method. Due to the Rays’, let’s say, “less than stellar” attendance over the years sampled, I did not need to worry about using a restricted dependent variable model to account for the capacity constraints of the Trop (the only sell out was typically the Opening Day or playoff games).
During testing, I became worried about serial correlation in the data. After adding a lagged dependent variable of one game as an independent variable, evidence of serial correlation dropped out.
The data set used in this post was (generously) provided by Mike Lortz. He did all of the hard and extremely tedious work of compiling and maintaining data for the years included in this analysis, the 2009-2014 seasons.
In my model, I have included the following independent variables:
All are dummy variables except Win Pct. and the Lag variable. I have omitted the following variables in order to compare the dummy variables:
I could have gone into much deeper detail, for example breaking out the promotions category into its individual parts, but I have decided to start my analysis at as high a vantage point as possible. I plan on expanding upon this model in subsequent posts, exploring the variables more thoroughly and adding new ones to further understand the demand for baseball in Tampa Bay. It should be noted then, that as more independent variables are added to the model, some of the results and conclusions that are found in this post could change. But, I wouldn’t suspect many large changes in the results of this regression – I would guess that some independent variables that are borderline statistically significant could be pushed one way or the other, but variables that are highly significant won’t change.
Okay, that’s a lot of technical mumbo-jumbo, so, congrats if you have made it this far – hopefully it gets a little bit more interesting from here on out.
Below are the results of the regression.

The first thing that should jump out is that the independent variable WINPCT (which, again, is a running win percentage for each season) is not statistically significant (that is, the amount of winning that the Rays do over a season doesn’t affect its attendance, game-to-game), and it’s not even close, really. This is contrary to what most other studies on major league attendance find (Hill, Madura, and Zuber (1982), Rascher (1996), Bruggink and Eaton (1996), McDonald and Rascher (2000), Coates and Harrison (2005)). Our result is supported anecdotally, though. As stated in the introduction, despite consistent winning over the last few years, the Rays have struggled to draw a crowd that matches their winning ways. This is a potentially huge confirmation of our intuition, and I look forward to further confirming this in later posts.
Next, we see that PROMO (a dummy variable that indicates whether there was a promotion at a particular game or not) is statistically significant and holds the expected sign. The results are interpreted as, if a promotion is held, we would expect an increase of about 3,452 people to attend that game. This represents a roughly 17% increase to attendance over the average from 2009-2014. This is generally supported by the literature (Lemke, Leonard and Tlhokwane (2010)). Next we see that OPEN (a dummy variable that indicates whether the game occurred on opening day) is statistically significant and holds the expected sign.
Now we come to the variables controlling for the opponent. The variables controlling for Boston, the Chicago White Sox, Cincinnati, Cleveland, Detroit, the Yankees, San Francisco, and Texas all were found to be statistically significant and have a positive sign. In other words, the attendance at a game featuring one of these teams as the visiting opponent is expected to be greater than a game featuring (the omitted variable) Toronto. Milwaukee, Minnesota, the Mets, Pittsburgh, and St. Louis were found to be significant at the 10% level. I would expect further testing to push their p-values to either a more insignificant level, or in increase those to the 5% threshold with the other teams listed above.
We now come to the temporal variables. The variables controlling for Monday and Tuesday are statistically significant and their coefficients have a negative sign, that is Monday and Tuesday are expected to draw less than a similar game on Thursday (the omitted variable, if you recall). Saturday and Sunday are also statistically significant, but their coefficients have a positive sign, similarly interpreted that we would expect a similar game held on a Saturday or Sunday to draw more than a game on a Thursday. There is no statistical evidence, though, to say that a game played on a Wednesday or Friday draws differently than a Thursday game, all else equal. This is consistent with what Lemke, Leonard and Tlhokwane (2010) found in their study.
Only the variable controlling for whether the game was played in the month of October was found to be statistically significant out of the months. It should be obvious that we would expect October to draw well because that is when playoff games are played. It is a bit surprising though that no other months are expected to differently than May.
Finally, we come to the variables that control for the year in which a game was played. Only 2009 and 2010 are statistically significant from the omitted 2013. The other three years have no statistical evidence to reject the null hypothesis. This means that there was a drop in attendance after the 2010 season that is not related to the Rays’ winning percentage, opponents played, or any other independent variable including in this model. What caused a statistically noticeable drop in attendance after 2010 that has been persistent since? Another question for another post.
III. Conclusion
The regression results for the Rays from 2009-2014 match some of the results, but not all, of the other studies. Fans respond positively to promotions and always come out in mass for opening day. Monday and Tuesday games draw worse than Thursday games while Saturday and Sunday games draw better. There isn’t a noticeable effect from the month in which a games is played except for October (but that’s because playoff games are in October). Most curiously, there is a noticeable drop in attendance from games played in 2009 and 2010 onward.
But the biggest surprise is the deviation from the literature in the effect of winning on attendance. My results show that fans in the Tampa Bay area do not respond to winning on a game-to-game basis. This would seem to indicate that the Rays have maximized the return on winning to attendance. In other words, if the Rays wish to increase their attendance, winning more isn’t an option.
Please email me with questions or comments!
jrsimmon(@)mail.usf.edu
References
Do you remember when everyone thought that the (Devil) Rays’ attendance problems would disappear when the team started winning? It’s been shown over and over again that attendance is correlated with winning, so the Rays shouldn’t be any different, right? Well, the team is winning (and has been for most of the last seven years) and the Rays are continually close to the bottom of the league in overall attendance. So, if Tampa Bay residents don’t care about a winning team, what do they care about? What draws them to a game?
I. Literature
There are numerous studies that aim to answer just that question, for both major and minor league baseball. The papers that most closely resemble this one include Siegfried and Eisenberg (1980), Paul, Toma, and Weinbach (2009) and McDonald and Rascher (2000), although there are some obvious differences in the way the studies are constructed. One of the major differences between all of the major journal articles that I’ve come across and this post is that they all focus on an entire league, be it major or minor, while I have chosen to study just the Rays organization. It will be interesting to see if conclusions that are common to each study hold when examining just the Rays. In other words: Does the demand for Rays’ baseball mirror the demand for baseball across the rest of the major league, or is there something unique about the Rays’ organization and/or Tampa Bay?
Within the literature (and this post) you can combine the independent variables used in the statistical models into groups. One group could be temporal variables such as start time of the game, day of the week, month, and year. Next, you could combine demographic variables (which I don’t include in my model because I’m focusing on just one team) controlling for population, income, race, etc. for a certain region surrounding the team(s). Another group would consist of promotions (either differentiated into different categories or aggregated), the opponent, and starting pitcher(s). Lastly, I would group performance variables together, these include win percentage for each game (or for the year, if studying attendance in the aggregate and not on a game-by-game basis), net total runs (to capture the relative excitement of a team’s games), pitcher’s respective records, and whether or not the team is in playoff contention or not (I only include win percentage in this analysis, but will explore others later). This list is not exhaustive and you could, if desired, break certain variables into pieces to study a certain topic of interest.
For the temporal variables, Lemke, Leonard and Tlhokwane (2010) found at the major league level, Monday through Friday games draw fewer fans than Saturday and Sunday afternoon games. Games played in April, May, and September are expected to draw worse than games played in July or August. At the minor league level, Paul, Paul, Toma and Brennan (2007) found that Tuesday, Thursday, and Friday all drew better than the omitted Wednesday variable, while Monday (and curiously enough) Saturday and Sunday didn’t have a significant difference in attendance than, again, a game played on Wednesday.
Lemke, Leonard and Tlhokwane (2010) determined that, again at the major league level, whether or not a promotion or giveaway occurred during a game does have a positive and significant effect on attendance. McDonald and Rascher (2000) and Hill, Madura and Zuber (1982) came to the same conclusion.
As for performance variables, I have included only Win Percentage (WINPCT). Hill, Madura, and Zuber (1982), Rascher (1996), Bruggink and Eaton (1996), McDonald and Rascher (2000), and Coates and Harrison (2005) all found that a higher win percentage led to an increase in attendance at the major league level.
II. The Model
I will balance being thorough in my reporting of the statistical model, while also realizing that some (if not most) might not have much experience interpreting the results. So, if something sounds complicated, just keep reading - I will reword it. On the other hand, if you do have a background in quantitative analysis, please, try to stay patient as I try to make things easy to understand.
(For help interpreting SPSS regression results, I suggest reading this. If you need to brush up on dummy variables, try this.)
I am using OLS as my regression method. Due to the Rays’, let’s say, “less than stellar” attendance over the years sampled, I did not need to worry about using a restricted dependent variable model to account for the capacity constraints of the Trop (the only sell out was typically the Opening Day or playoff games).
During testing, I became worried about serial correlation in the data. After adding a lagged dependent variable of one game as an independent variable, evidence of serial correlation dropped out.
The data set used in this post was (generously) provided by Mike Lortz. He did all of the hard and extremely tedious work of compiling and maintaining data for the years included in this analysis, the 2009-2014 seasons.
In my model, I have included the following independent variables:
- Win Pct.
- Promo (Y/N)
- Opening Day (Y/N)
- Opponent (Y/N)
- Day of the Week
- Month of the Year
- Year
- Lag of Previous Games Attendance
All are dummy variables except Win Pct. and the Lag variable. I have omitted the following variables in order to compare the dummy variables:
- Toronto
- May
- Thursday
- 2013
I could have gone into much deeper detail, for example breaking out the promotions category into its individual parts, but I have decided to start my analysis at as high a vantage point as possible. I plan on expanding upon this model in subsequent posts, exploring the variables more thoroughly and adding new ones to further understand the demand for baseball in Tampa Bay. It should be noted then, that as more independent variables are added to the model, some of the results and conclusions that are found in this post could change. But, I wouldn’t suspect many large changes in the results of this regression – I would guess that some independent variables that are borderline statistically significant could be pushed one way or the other, but variables that are highly significant won’t change.
Okay, that’s a lot of technical mumbo-jumbo, so, congrats if you have made it this far – hopefully it gets a little bit more interesting from here on out.
Below are the results of the regression.
The first thing that should jump out is that the independent variable WINPCT (which, again, is a running win percentage for each season) is not statistically significant (that is, the amount of winning that the Rays do over a season doesn’t affect its attendance, game-to-game), and it’s not even close, really. This is contrary to what most other studies on major league attendance find (Hill, Madura, and Zuber (1982), Rascher (1996), Bruggink and Eaton (1996), McDonald and Rascher (2000), Coates and Harrison (2005)). Our result is supported anecdotally, though. As stated in the introduction, despite consistent winning over the last few years, the Rays have struggled to draw a crowd that matches their winning ways. This is a potentially huge confirmation of our intuition, and I look forward to further confirming this in later posts.
Next, we see that PROMO (a dummy variable that indicates whether there was a promotion at a particular game or not) is statistically significant and holds the expected sign. The results are interpreted as, if a promotion is held, we would expect an increase of about 3,452 people to attend that game. This represents a roughly 17% increase to attendance over the average from 2009-2014. This is generally supported by the literature (Lemke, Leonard and Tlhokwane (2010)). Next we see that OPEN (a dummy variable that indicates whether the game occurred on opening day) is statistically significant and holds the expected sign.
Now we come to the variables controlling for the opponent. The variables controlling for Boston, the Chicago White Sox, Cincinnati, Cleveland, Detroit, the Yankees, San Francisco, and Texas all were found to be statistically significant and have a positive sign. In other words, the attendance at a game featuring one of these teams as the visiting opponent is expected to be greater than a game featuring (the omitted variable) Toronto. Milwaukee, Minnesota, the Mets, Pittsburgh, and St. Louis were found to be significant at the 10% level. I would expect further testing to push their p-values to either a more insignificant level, or in increase those to the 5% threshold with the other teams listed above.
We now come to the temporal variables. The variables controlling for Monday and Tuesday are statistically significant and their coefficients have a negative sign, that is Monday and Tuesday are expected to draw less than a similar game on Thursday (the omitted variable, if you recall). Saturday and Sunday are also statistically significant, but their coefficients have a positive sign, similarly interpreted that we would expect a similar game held on a Saturday or Sunday to draw more than a game on a Thursday. There is no statistical evidence, though, to say that a game played on a Wednesday or Friday draws differently than a Thursday game, all else equal. This is consistent with what Lemke, Leonard and Tlhokwane (2010) found in their study.
Only the variable controlling for whether the game was played in the month of October was found to be statistically significant out of the months. It should be obvious that we would expect October to draw well because that is when playoff games are played. It is a bit surprising though that no other months are expected to differently than May.
Finally, we come to the variables that control for the year in which a game was played. Only 2009 and 2010 are statistically significant from the omitted 2013. The other three years have no statistical evidence to reject the null hypothesis. This means that there was a drop in attendance after the 2010 season that is not related to the Rays’ winning percentage, opponents played, or any other independent variable including in this model. What caused a statistically noticeable drop in attendance after 2010 that has been persistent since? Another question for another post.
III. Conclusion
The regression results for the Rays from 2009-2014 match some of the results, but not all, of the other studies. Fans respond positively to promotions and always come out in mass for opening day. Monday and Tuesday games draw worse than Thursday games while Saturday and Sunday games draw better. There isn’t a noticeable effect from the month in which a games is played except for October (but that’s because playoff games are in October). Most curiously, there is a noticeable drop in attendance from games played in 2009 and 2010 onward.
But the biggest surprise is the deviation from the literature in the effect of winning on attendance. My results show that fans in the Tampa Bay area do not respond to winning on a game-to-game basis. This would seem to indicate that the Rays have maximized the return on winning to attendance. In other words, if the Rays wish to increase their attendance, winning more isn’t an option.
Please email me with questions or comments!
jrsimmon(@)mail.usf.edu
References
- Bruggink, Thomas H. and James W. Eaton. 1996. “Rebuilding Attendance in Major League Baseball: The Demand for Individual Games.” Baseball Economics: Current Research pp: 9-31
- Coates, Dennis and Thane Harrison. 2005. “Baseball Strikes and the Demand for Attendance.” Journal of Sports Economics 6: (3) pp. 282-302
- Hill, James Richard, Jeff Madura and Richard A. Zuber. 1982. “The Short Run Demand for Major League Baseball.” Atlantic Economic Journal 10:2 pp. 31-35
- McDonald, M., & Rascher, D. 2000. “Does bat day make cents? The effect of promotions on the demand for Major League Baseball.” Journal of Sport Management, 14, pp. 8-27.
- Paul, R.J., Weinbach, A.P., and Melvin, P. (2004) “The Yankee Effect: The Impact of Interleague Play and the Unbalanced Schedule on Major League Baseball Attendance." New York Economic Review, 35.
- Paul, Rodney J., Paul, Kristin K., Toma Michael, and Brennan Andrew. 2007. “Attendance in the NY-Penn Baseball League: Effects of Performance, Demographics, and Promotions.” New York Economic Review.
- Rascher, Daniel. “A Test of the Optimal Positive Production Network Externality in Major League Baseball.” Sports Economics: Current Research: pp. 33-45
- Robert J. Lemke, Matthew Leonard and Kelebogile Tlhokwane. 2010. “Estimating Attendance at Major League Baseball Games for the 2007 Season.” Journal of Sports Economics 1: pp. 316-348
- Siegfried, John J. and Jeff D. Eisenberg. 1980. “The Demand for Minor League Baseball.” Atlantic Economic Journal 8: (2) pp: 59-69
Saturday, February 21, 2015
Don't Compare Rays FanFest Attendance to Game Attendance
Rays FanFest was Saturday, February 21. Like previous fan fests, the event was a chance for fans to get excited about the upcoming baseball season. There were games, merchandise booths, autograph stations, several live media interviews, and numerous games for the kids.
According to Tampa Bay Times Rays writer Marc Topkin, Rays FanFest 2015 drew approximately 16,000 fans. From personal experience, there were a lot of people there and the field was covered in fans. Although movement wasn't impossible, there was a steady flow of people throughout the event.
Of course, there will always be people who attempt to prognosticate the Rays game attendance by FanFest attendance. Here are five reasons why that is a foolish idea and people who do that should be cast out into the bay:
There are probably many other reasons why there is no relationship between Rays FanFest attendance and Rays game attendance. The only commonality is that some of the same people might attend both. Not that FanFest isn't a great and fun event, it just has little to do the attendance of the actual games.
According to Tampa Bay Times Rays writer Marc Topkin, Rays FanFest 2015 drew approximately 16,000 fans. From personal experience, there were a lot of people there and the field was covered in fans. Although movement wasn't impossible, there was a steady flow of people throughout the event.
Of course, there will always be people who attempt to prognosticate the Rays game attendance by FanFest attendance. Here are five reasons why that is a foolish idea and people who do that should be cast out into the bay:
- FanFest was on a Saturday. The Rays drew an average of over 21,000 fans for weekend games in 2014. There is no time restriction on either side of the event. Fans didn't need to rush to FanFest nor rush home.
- FanFest was open all day. Fans could arrive at 10am, at noon, or at 4pm. They could spend five hours or five minutes. They could be late and not miss a thing. Time was not an issue at FanFest.
- FanFest was free. Everything about attending FanFest was free, from parking to admission into the stadium. No matter the size of the group, from one person to a family of five, the event was free.
- FanFests are not indicative of regular season attendance for other sports. Last season's Bucs FanFest drew approximately 30,000 fans. The Bucs per game average was nearly 60,000.
- Corporate attendance is not counted in FanFest. Yes, the Rays are lacking in corporate ticket sales. But at FanFest, the number is zero. Those corporate ticket sales will count during the season.
There are probably many other reasons why there is no relationship between Rays FanFest attendance and Rays game attendance. The only commonality is that some of the same people might attend both. Not that FanFest isn't a great and fun event, it just has little to do the attendance of the actual games.
Friday, February 20, 2015
Rays Front Office involved with Local Charities - Update
While catching up with my Tampa Bay Business Journal reading, I found this blurb by editor Alexis Muellner:
According to their website, the Rays front office consists of 193 people. This includes broadcasters, ticket sales, senior front office, and everyone in between. While executives are probably members of high profile boards, less experienced employees may be board members of young professional groups or charity organizations. So we can't say any personnel aren't "qualified" to be board members.
Regardless of who and the prestige of their organization, that 27% of all front office employees are in community leadership positions is a good thing. Involvement is good for the brand, the culture, and the community.
Entering the 2015 season, the Tampa Bay Rays front office staff has representatives on a combined total of 52 charitable advisory/foundation boards in the Tampa Bay area. Those organizations are focused on issues involving education, arts and culture, health/wellness, economic development, education, sports/recreation and tourism. Rick Vaughn, the Rays' VP of Communications, shared those details with me.
According to their website, the Rays front office consists of 193 people. This includes broadcasters, ticket sales, senior front office, and everyone in between. While executives are probably members of high profile boards, less experienced employees may be board members of young professional groups or charity organizations. So we can't say any personnel aren't "qualified" to be board members.
Regardless of who and the prestige of their organization, that 27% of all front office employees are in community leadership positions is a good thing. Involvement is good for the brand, the culture, and the community.
Thursday, February 19, 2015
Read by the St Pete City Council
Being read is a great feeling. Whether by fans, friends, fellow area writers, or national sports media, to know people read what I write is a very humbling notion. It drives me to write and research more.
I created this blog because I saw a need, a need for deeper research into the Tampa Bay baseball market. I write because I want to know more and think others would like to know more as well.
But I never thought my research would be referenced by a member of the St Petersburg City Council in a meeting about the future of a Rays stadium in St Pete. But that's what happened Thursday, according to Noah Pransky of Shadow of the Stadium.
I would like to thank Councilman Gerdes for reading. There is a lot more work to be done, but it is very rewarding to know my work is providing useful information and making a difference.
I created this blog because I saw a need, a need for deeper research into the Tampa Bay baseball market. I write because I want to know more and think others would like to know more as well.
But I never thought my research would be referenced by a member of the St Petersburg City Council in a meeting about the future of a Rays stadium in St Pete. But that's what happened Thursday, according to Noah Pransky of Shadow of the Stadium.
#StPete councilman Gerdes references "blog post" about 30min drive times. Read recent post from @TBBaseballMkt here: http://t.co/R1JcoTZTIC
— Shadow of Stadium (@StadiumShadow) February 19, 2015
I would like to thank Councilman Gerdes for reading. There is a lot more work to be done, but it is very rewarding to know my work is providing useful information and making a difference.
University of South Florida Baseball opens 2015 to good crowd
Although this site focuses primarily on professional baseball in Tampa Bay, I do occasionally need to mention the University of South Florida. USF is a Division-1 school with an academic population of over 40,000 in a population dense area of Tampa.
(Disclaimer: I am also an MBA candidate there.)
Besides its student population, USF baseball attendance is also comparable to the area minor league teams. Last year, the Bulls averaged 1,363 fans per game, almost 500 more fans per game than the Dunedin Blue Jays and only 250 less per game than the Bradenton Marauders.
Granted, there are major differences between the college and Minor League Baseball. Many of the USF tickets are acquired by students who not only have strong school loyalty but also get in for free - or more directly, pay for tickets through their tuition. There is also less variance in USF attendance. In 2014, for example, attendance for every USF baseball game was between 1,000 and 1,800 fans, except for two games versus Florida State University, one of which drew over 3,600 fans.
So opponent matters when looking at attendance for USF Baseball, especially if the Bulls play a team with a large alumni base in Tampa. This is another difference between USF Baseball and the local minor league teams, whose attendance is not often driven by opponent.
But the subject of opponent brings us to last night's game. Along with FSU, the University of Florida also has a large alumni base in the Tampa area. The USF Bulls opened their 2015 season versus the Gators in front of a crowd of 2,059.
Despite a larger alumni base, the crowd for UF versus USF in 2015 was smaller for than it was for USF versus FSU last year. Perhaps the presence of Heisman Trophy winner and football star Jameis Winston on the FSU baseball team brought many Seminole fans to USF's Red McEwan Field in 2014.
USF doesn't play UF or FSU in Tampa anymore this season, although they do play Florida A&M and regional rival the University of Central Florida before the season ends. Attendance probably won't be as high for USF baseball's other games as it was for Opening Night, but the Bulls should probably draw somewhere near what they did last year.
I will continue to keep an eye on the Bulls, especially as the weather warms and attending professional baseball becomes an option. Because as I mentioned in a previous post, a fan who attends USF Baseball over local professional baseball has made a choice. And choices are important when examining a market.
Sunday, February 15, 2015
Attendance Review: 2011 Clearwater Threshers
Welcome to our sixth attendance review of the Clearwater Threshers. This post continues our series of looking back at trends in Tampa Bay area fan behavior since 2007. Today we look at the home attendance of the 2011 Clearwater Threshers.
Overview: The Clearwater Threshers began play in the Florida State League in 1985. The Threshers moved to Bright House Field in 2004. Bright House Field is also the spring training home of the Philadelphia Phillies. In 2013, the population of Clearwater was 109,703.
Clearwater Threshers 2011:
Home Games: 71
Total attendance: 177,117 (up 2.55% from 2010: 172,716)
Per Game Average: 2,567 (up 1.06% from 2010: 2,540)
Highest attended game: 7,169 on Sunday, July 3rd vs Lakeland
Lowest attended game: 1,007 on Wednesday, June 1st vs St. Lucie
Double headers: 1 (July 9th)
Cancellations: 0
Notable rehab assignments: Chase Utley, Jose Contreras, Roy Oswalt
Other notable appearances: None
Overall:
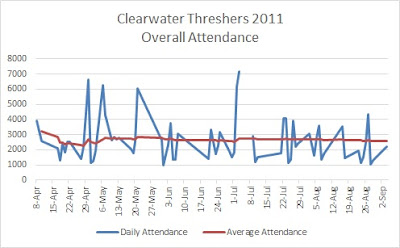
By Month:

The following graph depicts the average attendance by month.

By Day of the Week:

Threshers attendance increased 61.8% on the weekends compared to their average Monday through Thursday attendance.
The following graph depicts the average attendance by day.

The following chart shows how often each day outdrew the day prior.

By Opponent:

By Starting Pitcher:

This chart depicts how attendance reacted from one starter to the next. If a pitcher is a great draw, the percentage between he and the prior starter should be higher.

Overview: The Clearwater Threshers began play in the Florida State League in 1985. The Threshers moved to Bright House Field in 2004. Bright House Field is also the spring training home of the Philadelphia Phillies. In 2013, the population of Clearwater was 109,703.
Clearwater Threshers 2011:
Home Games: 71
Total attendance: 177,117 (up 2.55% from 2010: 172,716)
Per Game Average: 2,567 (up 1.06% from 2010: 2,540)
Highest attended game: 7,169 on Sunday, July 3rd vs Lakeland
Lowest attended game: 1,007 on Wednesday, June 1st vs St. Lucie
Double headers: 1 (July 9th)
Cancellations: 0
Notable rehab assignments: Chase Utley, Jose Contreras, Roy Oswalt
Other notable appearances: None
Breakdown:
(red shading = below annual average of 2,567)
Overall:

By Month:
The following graph depicts the average attendance by month.

By Day of the Week:
Threshers attendance increased 61.8% on the weekends compared to their average Monday through Thursday attendance.
- Mon-Thurs average attendance: 1,995
- Fri-Sun average attendance: 3,228
- Increase: 61.8%
The following graph depicts the average attendance by day.

The following chart shows how often each day outdrew the day prior.
By Opponent:
By Starting Pitcher:
This chart depicts how attendance reacted from one starter to the next. If a pitcher is a great draw, the percentage between he and the prior starter should be higher.
Tuesday, February 10, 2015
Links: Rays President Talks and a New Site Exploring Baseball Geography
A few links to pass along:
First: Shadow of the Stadium collected several tweets covering a recent speech Rays President Brian Auld did before the Economic Club of Tampa. There are definitely some great comments captured by Noah's site. Brian Auld covered the struggles of the fanbase, attendance, the use agreement with Tropicana Field, a possible move to Tampa, and other high-level topics. They are all insightful and highly recommended if you are interested in the business of the Tampa Bay Rays.
A little bit about the Economic Club of Tampa and why they were the forum for such a discussion:
Second: I'm glad to report my Fangraphs article exploring the relationship between 30-minute population and weekday/weekend attendance was well received. I got several compliments on the piece. But perhaps the biggest compliment came in something I found yesterday: a new blog inspired by my work.
Over at Baseball & GIS, Scott Bailey updated the 30-minute population radii around each Major League ballpark. He also plotted what he believes are 30-minute drives to each park. He admits, however, that he did not use rush hour as a variable in his calculations. Which leads me to think his blog is a good first step, but a lot of work needs to be done.
(For example, Scott has the intersection of Fowler Ave and I-275 as a 30 minute drive from Tropicana Field. That is highly unlikely on a Sunday afternoon, and absolutely impossible on weekday at 5pm.)
But I inspired someone to do research, which to me, is an awesome compliment. One of my aspirations of this website is to inspire people to do business analysis for every team in every market, whether it's demographic, economic, or marketing. There are a lot of people smarter than me on these subjects. The more issues they can shed light on, the more educated we will all be.
First: Shadow of the Stadium collected several tweets covering a recent speech Rays President Brian Auld did before the Economic Club of Tampa. There are definitely some great comments captured by Noah's site. Brian Auld covered the struggles of the fanbase, attendance, the use agreement with Tropicana Field, a possible move to Tampa, and other high-level topics. They are all insightful and highly recommended if you are interested in the business of the Tampa Bay Rays.
A little bit about the Economic Club of Tampa and why they were the forum for such a discussion:
The Economic Club of Tampa provides a dynamic forum for business, professional, elected and community leaders to identify and discuss economic, social and political issues.
Second: I'm glad to report my Fangraphs article exploring the relationship between 30-minute population and weekday/weekend attendance was well received. I got several compliments on the piece. But perhaps the biggest compliment came in something I found yesterday: a new blog inspired by my work.
Over at Baseball & GIS, Scott Bailey updated the 30-minute population radii around each Major League ballpark. He also plotted what he believes are 30-minute drives to each park. He admits, however, that he did not use rush hour as a variable in his calculations. Which leads me to think his blog is a good first step, but a lot of work needs to be done.
(For example, Scott has the intersection of Fowler Ave and I-275 as a 30 minute drive from Tropicana Field. That is highly unlikely on a Sunday afternoon, and absolutely impossible on weekday at 5pm.)
But I inspired someone to do research, which to me, is an awesome compliment. One of my aspirations of this website is to inspire people to do business analysis for every team in every market, whether it's demographic, economic, or marketing. There are a lot of people smarter than me on these subjects. The more issues they can shed light on, the more educated we will all be.
Sunday, February 8, 2015
Importance of Tampa Bay's Hispanic Baseball Fan Demographic
There was an interesting article in Forbes a few weeks ago detailing in what US cities are Hispanics doing the best economically. According to writer Joel Kotkin, Tampa-St. Pete was the second best city for Hispanics in Florida and ranked 12th overall in the country.
A bit about Forbes methodology:
Tampa-St. Pete was behind Jacksonville (1st), but ahead of Orlando (13th), and Miami (16th).
Last week, Jo-Lynn Brown of the Tampa Bay Business Journal wrote about the Forbes article and added the following map detailing the Hispanic population in the Tampa Bay area.

The success of the Hispanic population is very important for baseball in Tampa Bay. According to recent polls, no other group in Florida prefers baseball as much. In a June 2014 poll released by PublicPolicyPolling.com, 88% of Hispanics in Florida are baseball fans. The second highest group are "Whites" with 64%.
Among Hispanics in Florida, the Marlins are the most preferred team with 41% of fans. The Yankees and Braves are second with 13%, and the Red Sox are fourth with 9%. The Rays are the fifth most popular team among Florida Hispanics with 8%.
The high percentage of Marlins fans make me think of the 672 total polled voters statewide, most of Hispanics polled were from the Miami area. Regardless of where they are from, the Rays should not be fifth in their own state. That's unacceptable. They should be no worse than third, even giving room to the high percentage of Yankees fans in Florida (which we explored here).
As Tampa's Hispanic population continues to grow and become more economically affluent, it will be increasingly more important for area baseball teams to target this market. Especially the Rays. The area's Major League team should focus their efforts as much as possible on turning Tampa Bay area Hispanics into Rays fans.
A few ideas:
According to the US Census quick facts page:
Total Hispanic baseball fans in Tampa, St. Pete, and Clearwater: 101,625
A bit about Forbes methodology:
We weighed these metropolitan statistical areas by three factors — homeownership, entrepreneurship, as measured by the self-employment rate, and median household income — that we believe are indicators of middle-class success. Data for those is from 2013. In addition, we factored in the change in the Hispanic population from 2000 to 2013 in these metro areas, to judge how the community is “voting with its feet.”
Tampa-St. Pete was behind Jacksonville (1st), but ahead of Orlando (13th), and Miami (16th).
Last week, Jo-Lynn Brown of the Tampa Bay Business Journal wrote about the Forbes article and added the following map detailing the Hispanic population in the Tampa Bay area.

The success of the Hispanic population is very important for baseball in Tampa Bay. According to recent polls, no other group in Florida prefers baseball as much. In a June 2014 poll released by PublicPolicyPolling.com, 88% of Hispanics in Florida are baseball fans. The second highest group are "Whites" with 64%.
Among Hispanics in Florida, the Marlins are the most preferred team with 41% of fans. The Yankees and Braves are second with 13%, and the Red Sox are fourth with 9%. The Rays are the fifth most popular team among Florida Hispanics with 8%.
The high percentage of Marlins fans make me think of the 672 total polled voters statewide, most of Hispanics polled were from the Miami area. Regardless of where they are from, the Rays should not be fifth in their own state. That's unacceptable. They should be no worse than third, even giving room to the high percentage of Yankees fans in Florida (which we explored here).
As Tampa's Hispanic population continues to grow and become more economically affluent, it will be increasingly more important for area baseball teams to target this market. Especially the Rays. The area's Major League team should focus their efforts as much as possible on turning Tampa Bay area Hispanics into Rays fans.
A few ideas:
- Open a Rays Store in Ybor City
- Host an exhibition of area Cuban baseball players at Tropicana Field before a Rays game
- Host a Cuban Heritage Night (not sure if this done already) with prominent Cuban Tampa leaders throwing out the first pitch
- Start a shuttle bus from West Tampa to Tropicana Field a few times a year (on non-Yankees games preferably)
According to the US Census quick facts page:
- Tampa population: 352,957
- Hispanic population: 23.1% = 81,180
- Baseball fans: 88% = 71,438
- St. Pete population: 249,688
- Hispanic population: 6.6% = 16,479
- Baseball fans = 14,502
- Clearwater population: 109,703
- Hispanic population: 14.2% = 15,577
- Baseball fans: 88% = 13,708
Total Hispanic baseball fans in Tampa, St. Pete, and Clearwater: 101,625
Wednesday, February 4, 2015
What type of baseball market is Tampa Bay? Or all of the above?
There were two interesting articles in the last week on baseball in Tampa Bay.
Last Friday, Marc Topkin of the Tampa Bay Times interviewed new MLB Commissioner Rob Manfred. When asked about the viability of Tampa Bay to be the long-term home of Major League Baseball, the commissioner replied,
That's a good thing.
Meanwhile, on Tuesday in an article in the St. Petersburg Tribune, the mayors of Clearwater and Dunedin commented on the need to make sure professional baseball stays in their neighborhoods. The article provided an update on the ongoing secret negotiations between the Blue Jays and the City of Dunedin to keep the Jays in the Tampa Bay suburb.
The Mayor of Clearwater agreed.
Both locations also intend on increasing their appeal for their minor league teams and other events.
So which is it? Is Tampa Bay a Major League market or a multi-Minor League market? Does the area have the economic strength to support more baseball per capita than any other region in the US?
According to the article, the Blue Jays and Phillies have an economic impact of $200 million dollars per year. There is some validity that this might not all be a substitution effect, or the shuffling of local dollars from one venue of entertainment to another. In a 2009 study, 70% of polled Phillies spring training attendees and 57% of Blue Jays spring training attendees were from out-of-state. Using the 2009 poll and 2014 attendance, that would mean 85,341 fans came to Clearwater from out-of-state and 38,703 came to Dunedin from out-of-state.
However, in the 2010 ABC Coalition Report on the viability of the Tampa Bay area to retain Major League Baseball, the commission concluded "people across our region must quell patriarchal differences and view this process as a cooperative, regional endeavor".
Is Tampa Bay a market that can sustain all levels of professional baseball from mid-February to early October?
That seems to be a heavy load.
Last Friday, Marc Topkin of the Tampa Bay Times interviewed new MLB Commissioner Rob Manfred. When asked about the viability of Tampa Bay to be the long-term home of Major League Baseball, the commissioner replied,
"I think with an appropriate facility that Tampa Bay can be a vibrant major-league market," Manfred said.
That's a good thing.
Meanwhile, on Tuesday in an article in the St. Petersburg Tribune, the mayors of Clearwater and Dunedin commented on the need to make sure professional baseball stays in their neighborhoods. The article provided an update on the ongoing secret negotiations between the Blue Jays and the City of Dunedin to keep the Jays in the Tampa Bay suburb.
“Our staff and the entire (city) commission is dedicated to negotiating the best deal for our residents and our region,” (Dunedin Mayor Bujalski) said. “We’re not going to give away the farm. We’re not going to do anything that is not in the best interest of everyone. But that certainly doesn’t negate that we really, really want the Blue Jays to stay here. It’s important to us.”
The Mayor of Clearwater agreed.
Keeping the Phillies and Jays in Pinellas, as well as the Yankees in Tampa and other teams in their respective Florida cities for spring training, is critical, especially as Arizona now hosts half of the 30 major league teams. (Clearwater Mayor George) Cretekos, born and raised in Tarpon Springs, recalled when all but four major league teams trained in Florida – and four in Pinellas alone.
“We need to make sure we keep the teams we have in the area, and hopefully find ways to expand,” he said.
Both locations also intend on increasing their appeal for their minor league teams and other events.
Bujalski said Dunedin, too, will try to broaden the appeal of its stadium, to make it suitable for concerts and other events. Like the Phillies, the Blue Jays have their Class A Florida State League team here all summer.
“It’s not just about six to eight weeks in the spring,” she said.
So which is it? Is Tampa Bay a Major League market or a multi-Minor League market? Does the area have the economic strength to support more baseball per capita than any other region in the US?
According to the article, the Blue Jays and Phillies have an economic impact of $200 million dollars per year. There is some validity that this might not all be a substitution effect, or the shuffling of local dollars from one venue of entertainment to another. In a 2009 study, 70% of polled Phillies spring training attendees and 57% of Blue Jays spring training attendees were from out-of-state. Using the 2009 poll and 2014 attendance, that would mean 85,341 fans came to Clearwater from out-of-state and 38,703 came to Dunedin from out-of-state.
However, in the 2010 ABC Coalition Report on the viability of the Tampa Bay area to retain Major League Baseball, the commission concluded "people across our region must quell patriarchal differences and view this process as a cooperative, regional endeavor".
Is Tampa Bay a market that can sustain all levels of professional baseball from mid-February to early October?
That seems to be a heavy load.
Tuesday, February 3, 2015
The Rays and the importance of the 30-minute population radius
Whenever I write something with a scope that exceeds the Tampa Bay market, I like to pitch it to more widely-read sites. So it is with great pride that I'd like to introduce my latest for baseball research site Fangraphs.com - a study on the impact of the 30-minute population radius and MLB attendance.
What team had the smallest difference between weekend and weekday attendance? Which team had the largest?
Is there a relationship between local population and the weekend/weekday increase? Would it be smaller for teams with higher local population?
As most Rays fans might expect, the Rays did not do well in my findings. As a matter of fact, they were last in everything: weekday attendance, weekend attendance, highest difference between weekend and weekday attendance, and smallest 30-minute population.
But on a positive note, the folks at Fangraphs.com liked my research so much, they promoted it from their community blog to the front page of their site.

Sunday, February 1, 2015
Why the Ted Williams Museum should leave Tropicana Field

On January 31, the Ted Williams Museum and Hitters Hall of Fame inducted six new members. These superstars were recognized in a ceremony at Tropicana Field that included the inductees, several Tampa area former ballplayers, a few Rays players, and an actor from the movie Field of Dreams.
Taking nothing from the accomplishments of Tim Raines, Jim Thome, Thurman Munson, Denny McClain, and Jim Kaat, the celebration at the Ted Williams Museum raises two interesting questions: why the museum is where it is and what is the future of the museum.
In 1994, the Ted Williams Museum opened its doors as a living shine to one of the best hitters in baseball history. When it was established, the museum was located in Citrus Hills, Florida, a small community in Hernando County, a little over an hour from the Tampa Bay area. The Citrus Hills location was selected as it was near Williams's home and was the centerpiece to the Citrus Hills development, owned in part by one-time Red Sox part-owner Sam Tamposi. Williams not only lived in Citrus Hills, he was also the spokesperson for the community.
With attendance dwindling due to its out-of-the-way location (a familiar refrain), the museum moved to Tropicana Field in 2006. Today, the museum is part of the Rays game experience and admission is free on game days.
Besides being a showcase for Williams and other great hitters in Major League history, the museum is also home to the Ted Williams Foundation. According to its website, the Ted Williams Foundation
"is a 501 (c)(3) non-profit institution that provides for the continued existence of the Ted Williams Museum & Hitters Hall of Fame as well as to provide for its youth programs and scholarships for deserving student-athletes. The Ted Williams Foundation also provides assistance to charitable organizations such as the Boys & Girls Club, the Children's Hospital at Dartmouth-Hitchcock, the Rays, Red Sox, Orioles, Phillies, and Twins Foundations in baseball, the Tampa Bay Lightning Foundation in the NHL, and Dolphins Foundation in the NFL, with all funds directly assisting youth programs.
While the existence of the museum is great and the causes the museum stands for are commendable, it's time to move the Ted Williams Museum from Tropicana Field.
Admittedly, I'm not sure who negotiated the deal to put the Ted Williams Museum in the Trop. Was it the Rays or was it the City of St. Petersburg? Is the museum paying rent to the Rays or to the city? Whoever the deal is with, here are several reasons the Rays or the City of St Pete should cut ties with the Ted Williams Museum.
There is no connection - Yes, Ted Williams loved Florida. He loved the Florida Keys and he loved fishing in the Tarpon Springs area. But that is not a good reason to house the museum in its current location. Williams was born in San Diego and made his career in Boston. The Trop was convenient when the original museum closed, as it was close, but now a permanent home should be found where Williams's legacy will be better acknowledged and appreciated.
Not built for Florida baseball fans - As mentioned before, Ted Williams was a spokesperson for Citrus Hills in an attempt to help a former Red Sox co-owner. Williams's mission was to sway New England retirees to move to Citrus Hills. The museum was built with New England fans in mind. It was not built for Florida sports fans. Williams never played baseball in Florida. Outside of general baseball appreciation, there is no reason for Florida baseball fans to visit. The museum does not speak to the history of their community.
Doesn't help the Rays community - Not only is the Ted Williams Museum devoid of Florida baseball history, its presence actually enforces out-of-state fandom. Ted Williams was a Red Sox. His career is synonymous with the Red Sox. In an area where the baseball demographic is so splendidly splintered, hosting a shrine to a legend of a rival team makes little sense. Using the "retirement location" logic, should we expect a Derek Jeter Museum to also open in the home of the Rays?
There is a better option - Sometime in the very near future, the Tampa Baseball Museum will open. This museum will be located in the Ybor City home of Al Lopez, Tampa's first Major League Hall of Famer. While the museum will focus primarily on the baseball history of Tampa, why not create a subsidiary museum for baseball across the bay and tell the story of Al Lang and baseball in St Petersburg? The Tampa Baseball Museum is already a cross-Bay venture with support by the Rays and St. Pete-based design group Creative Arts Unlimited.
Social Media embarrassment - Not only is the Ted Williams Museum website seldom updated, but its twitter feed has been controversial to the point of confrontational. For example, following the City Council vote in December to not let the Rays look for other possible stadium locations, the Ted Williams Museum tweeted this:
Thank you Council of St Pete 4 understand that its all about what extra money u can stuff into ur pockets. Great job on pier too! #Geniuses
— Ted Williams Museum (@TWmuseum) December 19, 2014
That's not smart at all.
The Ted Williams Museum twitter account has also posted such irrelevance such as asking for fantasy football advice and re-tweeting negative comments about Rays pitcher Grant Balfour. Social media should be personable, but that's not a good look.
Move now before it's too late - Eventually, the Rays will leave Tropicana Field. They are going somewhere, whether to a new stadium in Pinellas County, a stadium in Hillsborough County, a stadium in Montreal, or a location in Nashville, Columbus, or Sheboygan. Wherever they go, the Rays' time in Tropicana Field is limited. With the City of St Pete already considering the value of the Tropicana Field property, there is no chance the Ted Williams Museum will stay in its current location past 2027. The museum should explore locations now in preparation for whatever decision the Rays and the City of St Pete make. Moving as soon as possible would give the museum time to establish and could actually make the museum more money if moved to a more profitable area such as San Diego or near Fenway Park.
While convenient, the relationship between Tropicana Field and the Ted Williams Museum has run its course. There is little the Ted Williams Museum can contribute to the Tropicana Field experience that would benefit the Rays. If anything, the museum is detracting from the Rays' mission of winning the market. Finding a new home for the Ted Williams Museum and Hitter's Hall of Fame would be in the best interest of the museum, Tropicana Field, and the Tampa Bay Rays.
Subscribe to:
Posts (Atom)