A few weeks ago, the American City Business Journals published a study that
explored the economic capacity of various sports markets in America and Canada. The study was designed to see which markets were underutilized in regards to sports and which markets, if any, were overstretched. The results also gave insight into if expansion or franchise relocation were to happen, where should teams move to and where might they be best to move from.
The amount of research done in this study was massive. According to their methodology page, the ACBJ used a metric called Total Personal Income (TPI), “the sum of all money earned by all residents of an area in a given year”. This data came from 2013, “the latest year for which statistics are available from the U.S. Bureau of Economic Analysis.”
After determining TPI,
the ACBJ did the following:
- Analyzed U.S. combined statistical areas and metropolitan statistical areas (as defined by the U.S. Office of Management and Budget) and Canadian census metropolitan areas (as defined by Statistics Canada).
- Used team revenue data and average ticket prices to estimate the amount of TPI needed to adequately support a team in each of the professional leagues, as well as any of the 64 college football/basketball programs within the Power Five conferences (Atlantic Coast, Big Ten, Big 12, Pacific-12 and Southeastern)
- Determined minimum TPI bases to be $104 billion for an MLB team, $48 billion in the NFL, $45 billion in the NBA, $50 billion in the NHL, $14 billion in MLS and $26 billion in the Power Five.
- Calculated each area’s remaining amount of TPI by subtracting the sums needed to support the market’s existing teams.
Of course, there were some shortcomings to the study and not every market is the same. As the methodology page states in its conclusion,
Economic capacity is only one facet of any decision to expand or relocate. Other considerations would obviously be of similar importance, such as the proximity to existing teams, the availability of stadiums or arenas, and unique local factors.
The study also does not factor in non-Major League sports, such as non-MLS soccer, arena football, or Minor League Baseball. All of which Tampa Bay has.
According to the study, the Tampa Bay area is tied for the fifth most overextended market in professional sports.
Based on the ACBJ study,
Tampa-St Pete compares well with
Pittsburgh and
Kansas City in regards to market size, amount of teams, TPI, and the over-extension of their markets. Also of note, both cities with Spring Training (Phoenix and Tampa Bay) are considered overextended. Although Spring Training is heavily influenced by tourist income, there are many local dollars being spent on Spring Training in the Tampa Bay area.
When combined with demographics, the Tampa Bay market looks even worse, especially for the Tampa Bay Rays. Using the
Facebook/New York Times survey from 2014, data shows 56% of Pinellas County and 51% of Hillsborough County are Rays fans. Comparably, 68% of Pittsburgh’s Alleghany County roots for the Pirates and 64% of Kansas City’s Jackson County roots for the Royals.
While not every resident is on Facebook or “likes” the team on Facebook, if we believe “liking” behavior is the same in the Tampa Bay area and is the same as it is in Pittsburgh and Kansas City, then we have to conclude the Rays have less local support than the Pirates or Royals.
So not only does the area lack the funds to support the Rays, the Rays lack the people willing to provide it funds.
Comparing Baseball to Baseball
There was a second interesting article published last week exploring market support for sports. This article focused specifically on baseball and calculated
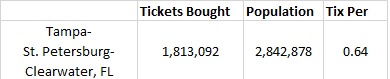
total baseball ticket purchases per population. It totaled tickets purchases for Major and Minor League Baseball in each market and divided the total by population – basically, how many baseball tickets the average person in an area buys.
According to author Brett McGinness, Tampa Bay baseball fans almost buy as many tickets per person as residents of the City of Boston (.67) and slightly more than the residents of Washington DC (.62).
Again, some interesting points: this does not include Bradenton in the Tampa Bay area, which I normally do. It only includes purchases for the Rays, Tampa Yankees, Dunedin Blue Jays, and Clearwater Threshers. It also does not include Spring Training.
Let’s assume half of the 341,379 tickets purchased in 2014 for Yankees, Phillies, and Blue Jays Spring Training were done by locals. That would mean 170,690 more tickets purchased from Tampa Bay baseball fans. Let’s see how the chart changes.
By adding half of Spring Training, the Tampa Bay area moves from 15th on McGinness’s chart to 11th, above San Diego and Seattle, and below Minneapolis-St. Paul. However, the Tampa Bay area still purchased only 70% of the baseball tickets per person that residents of Pittsburgh (1.07) and Kansas City (1.08) purchased.
While adding a fraction of Spring Training ticket purchases is good for the area, for the Rays, adding Spring Training to the equation is also not good. With the addition of 50% of Spring Training tickets, the Rays share of total Tampa Bay baseball tickets purchased drops from 80% to 73%. Comparatively, the Indians,
another team with low attendance and several Minor League teams in the area, have 81% of Cleveland area baseball ticket purchases.
Looking again at Kansas City and Pittsburgh, Google maps shows those teams do not have the Minor League competition the Rays face. The only
Minor League team in Missouri or Kansas is the Springfield Cardinals in Springfield, Missouri, 165 miles from Kansas City. While Pennsylvania has several Minor League teams, the team closest to the Pittsburgh Pirates is the Altoona Curve, 95.7 miles away.
Considering their lack of competition, there is a good chance 100% of baseball ticket purchases in Pittsburgh and Kansas City are for Pirates and Royals games, respectively.
Of course, we can’t get carried away with Minor League competition. Minor League Baseball does not eat into the above-mentioned TPI as much as Major League sports do. The average Florida State League ticket is $4-6 and parking is often free, if not less than $5. Minor League teams also often have discounted ticket promotions, ranging from $1 to 2-for-1 to free.
However, while Minor League Baseball in Tampa Bay doesn’t have a large economic impact, it may be an acceptable
substitute good, especially for the casual fan who just wants to hang out, grab a beer, and could care less about a score. And according to another McGinness post,
the three Tampa Bay area Florida State League teams have the lowest season ticket costs in professional baseball.
As a matter of fact, you could buy season tickets to all three Tampa Bay area Minor League teams (210 games total) for $601.45. As of May 20th, a Rays
June-October weekend-only season ticket plan (27 games) costs $551.30.
So what does all this mean for Tampa Bay sports, and the Rays in particular?
Through the work of the ACBJ and Brett McGinness, we can conclude the Tampa Bay market is overstretched and over-saturated, especially in baseball. The decisions of professional sports leagues and city governments in St. Petersburg, Tampa, Clearwater, and Dunedin have created an environment difficult for the success of Major League sports. The Tampa Bay Lightning and Tampa Bay Buccaneers are fortunate a majority of their seasons do not overlap with other sports. For the Tampa Bay Rays, until major market changes occur, reliance on revenue sharing and opposing fanbases is essential to their success.