Sunday, November 27, 2016

Dunedin Blue Jays Attendance Analysis 2007 - 2016: By Month

Welcome to our 1st second-level analysis post on Dunedin Blue Jays attendance from 2007-2016. This post examines the Blue Jays attendance by month. This post will look at September games, but only as they pertain to the regular season. Postseason games will be examined at a later date.

First, a look at the Blue Jays average annual and per game attendance from 2007-2016. From 2007-2016, the Blue Jays average annual attendance was 45,578. The Blue Jays per game average in the 656 games at Florida Auto Exchange Stadium from 2007 to 2016 was 730.

Click here for Dunedin Blue Jays season average attendance 2007-2016 charts and analysis.

Next, we will look at Blue Jays average attendance by month from 2007 to 2016. The following graph depicts the Blue Jays average attendance per month.


The following chart depicts their best and worst average attended months.


This chart shows the annual attendance ranking by month each year spanning from 2007 to 2016 as well as the month’s average finish.

(Yellow highlights = Best month/ Red highlights = Worst month)


The next few charts depict average attendance per month per year from 2007 to 2016.

April average per game attendance 2007 to 2016:


May average per game attendance 2007 to 2016:


June average per game attendance 2007 to 2016:


July average per game attendance 2007 to 2016:


August/September average per game attendance 2007 to 2016:


Percentage Changes Since 2007:
  • April: up 32%
  • May: up 18.5%
  • June: up 1%
  • July: up 37%
  • August/Sept: down 35%

Analysis:

Overall, Dunedin Blue Jays per game attendance has increased 6% per game since 2007 - from 721 per game to 770 per game in 2016. Most of this increase was due to increases in April and July attendance. This increase is similar to monthly increases in Clearwater Threshers attendance, which is only 10 minutes away from Dunedin.


The biggest difference between the two teams is the Blue Jays have seen a steep drop in Aug/Sept attendance since 2007. In the Threshers post, I stipulated that weather could be the reason attendance has increased in April and May. Better promotions could also be a factor.

July attendance is heavily influenced by 4th of July attendance. The Blue Jays fireworks celebration is typically their most attended game of the year. Since 2012, the Jays have drawn over 4,000 fans per Independence Day fireworks promotion (usually either July 4th or the closest home game to the date). In 2011, the Jays only drew 2,000 to their fireworks event, and in 2010 and earlier, there was no fireworks promotion.

Looking at the by-month chart, the August/September decline began in 2008, the same year the Rays made the World Series. After also declining in 2009, Blue Jays attendance in August/September has only slightly recovered.

The Blue Jays are the lowest drawing Minor League team in the Tampa Bay area. Looking at when people attend their games show us quite a bit about the patterns of baseball attendance in Dunedin and Tampa Bay as a whole.

Thursday, November 24, 2016

Clearwater Threshers Attendance 2005-2016

Over the last few weeks, we have looked at the 2016 attendance of Minor League teams in the Tampa Bay area. This week, I want to look at each team individually, and see how 2016 fares in the context of their attendance since 2007.

Today, we start with the Clearwater Threshers. The Threshers moved into Bright House Field in 2004.

The following chart shows Threshers total games, total attendance, and attendance per game.

While the chart shows 2005 and 2006, the total and average rows are only for 2007-2016, since I do not yet have a game-by-game breakdown of 2005 and 2006.

(Note: Doubleheaders only count for one game's attendance. For example, a team might play 70 games and one doubleheader, thus resulting in only 69 attendance dates. In order to calculate "true" per game attendance, we have to subtract the null game of doubleheaders.)


The Threshers 2016 attendance was the second highest turnout in franchise history, behind only their 2014 turnout. Threshers total attendance has been over 170,000 fans each year since 2010. Threshers average attendance has been over 2,500 each year since 2010. The Threshers remain the highest attended team in the Tampa Bay area and often have been the highest attended team in the Florida State League.

The following graph depicts the total attendance column in the above chart.


The following graph depicts the average per game attendance column in the above chart.


Tuesday, November 22, 2016

Dunedin Blue Jays Attendance 2005-2016

Over the last few weeks, we have looked at the 2016 attendance of Minor League teams in the Tampa Bay area. This week, I want to look at each team individually, and see how 2016 fares in the context of their attendance since 2007.

Today, we start with the Dunedin Blue Jays. The Blue Jays have played in Dunedin since 1977.

The following chart shows Blue Jays total games, total attendance, and attendance per game.

While the chart shows 2005 and 2006, the total and average rows are only for 2007-2016, since I do not yet have a game-by-game breakdown of 2005 and 2006.

(Note: Doubleheaders only count for one game's attendance. For example, a team might play 70 games and one doubleheader, thus resulting in only 69 attendance dates. In order to calculate "true" per game attendance, we have to subtract the null game of doubleheaders.)


The Blue Jays have seen a decline in attendance since 2014. The Jays steep increases in 2011 and 2012 and have been over 50,000 fans per season since. The Blue Jays remain the lowest attended team in the Tampa Bay area and often have been the lowest attended team in the Florida State League.

The following graph depicts the total attendance column in the above chart.


The following graph depicts the average per game attendance column in the above chart.


Monday, November 21, 2016

Tampa Yankees Attendance 2005-2016

Over the last few weeks, we have looked at the 2016 attendance of Minor League teams in the Tampa Bay area. This week, I want to look at each team individually, and see how 2016 fares in the context of their attendance since 2007.

Today, we will look at the Tampa Yankees. The Yankees have been playing in Tampa since 1994.

The following chart shows Yankees total games, total attendance, and attendance per game.

While the chart shows 2005 and 2006, the total and average rows are only for 2007-2016, since I do not yet have a game-by-game breakdown of 2005 and 2006.

(Note: Doubleheaders only count for one game's attendance. For example, a team might play 70 games and one doubleheader, thus resulting in only 69 attendance dates. In order to calculate "true" per game attendance, we have to subtract the null game of doubleheaders.)


The Yankees have seen a decline in attendance since 2013. From 2013 to 2016, annual attendance has declined 39%. Per game attendance has declined 37%. In 2016, the Yankees had their lowest total and per game attendance since before 2005.

The following graph depicts the total attendance column in the above chart.


The following graph depicts the average per game attendance column in the above chart.


Sunday, November 20, 2016

Bradenton Marauders Attendance 2010-2016

Over the last few weeks, we have looked at the 2016 attendance of Minor League teams in the Tampa Bay area. This week, I want to look at each team individually, and see how 2016 fares in the context of their attendance since 2007.

Today, we start with the Bradenton Marauders. The Marauders started play in 2010.

The following chart shows Marauders total games, total attendance, and attendance per game.

(Note: Doubleheaders only count for one game's attendance. For example, a team might play 70 games and one doubleheader, thus resulting in only 69 attendance dates. In order to calculate "true" per game attendance, we have to subtract the null game of doubleheaders.)


The Marauders have seen a decline in attendance since 2013. While the decline was small in 2014 and 2015, attendance declined 151 fans per game in 2016. For the first time since their inaugural season, the Marauders had a total attendance under 100,000 fans.

The following graph depicts the total attendance column in the above chart.


The following graph depicts the average per game attendance column in the above chart.


Wednesday, November 16, 2016

Tampa Bay Rays, Minor League Baseball, and Spring Training Attendance Totals 2007 - 2016

Since I looked at the 2016 attendance trends of the Rays and each Tampa Bay regional Minor League team over the last few weeks, I thought I would bring the view out a little bit, showing how 2016 did in regards to other years. Today we will start with the total market, the Rays, Spring Training, and Minor League Baseball overall.

Next week, we will look at each Minor League team individually.

Overall Tampa Bay Baseball Market

In 2016, the Tampa Bay baseball market drew 2,128,040. This was a decrease of 0.85% (18,202 fans) from 2015's total attendance of 2,146,242. Since 2005, the Tampa Bay Baseball Market has drawn 27,982,200 fans.


The following graph depicts the previous chart.


Rays Attendance since 2005

I've mentioned before that Rays attendance increased in 2016 by 3%. The Rays totaled 1,286,163 fans in 2016. Since 2005, the Rays have totaled 18,004,319, an average of 1,636,756.


The following graph depicts the previous chart.


Since 2005, the Rays have accounted for 64% of baseball tickets sold in Tampa Bay. In 2016, they accounted for 60%, a 2% increase over 2015, but 11% lower than 2009 and 2010 ticket sales.


The following graph depicts the previous chart.


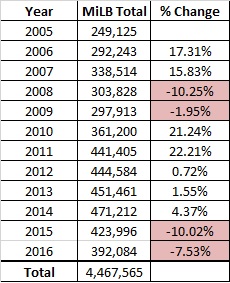
Tampa Bay Minor League Attendance 2005-2016

Since 2005, Minor League Baseball in Tampa Bay has drawn 4,467,565. In 2016, total Minor League attendance decreased 7.5% or 31,912 tickets. This is the second year in a row Minor League attendance in Tampa Bay has decreased. As mentioned, individual team analysis by year will be posted next week.


The following graph depicts the previous chart.


Tampa Bay Spring Training 2005-2016

I covered regional Spring Training in depth earlier this year but just to reiterate, regional Spring Training decreased 5% in 2016 to 449,793.


The following graph depicts the previous chart.


Sunday, November 13, 2016

How strong is Tampa Bay baseball fandom?

A few months ago, a New York Knicks fan posted a video on SB Nation that dove into the concept of fandom. In the video, Michael Imhoff talked to college professors and other fan psychology experts on why fans exist and why they put themselves through the torture of sports, an endeavor where out of dozens of fanbases, only one group ends the season happy.

Check it out:


The biggest takeaway in the video is Imhoff's mention of the Sports Spectator Identification Scale and its three classes of fans:
  • Lowly identified
  • Moderately identified
  • Highly identified

40% of baseball attendance in Tampa Bay is to Spring Training and Minor League Baseball. These are lowly to moderately identifying games. People do not usually get overly upset if a team loses in Spring Training. Only a few people get overly upset when a Minor League team loses. Of the Tampa Bay baseball entities, only the Rays require Moderately to Highly Identified fans.

That's not good if there is a competition for dollars.

Because there is so much baseball in Tampa Bay, we have diluted fandom. We have reduced the incentive to be highly identified fans. The reason people attached themselves to the Tampa Bay Lightning is because they are the only hockey team in town. They create a sense of community. Hockey fans leave happy or sad depending on the Lightning score.

In baseball, this is not the case. While Minor Leagues and Spring Training don't demand high identification, the Rays struggles over the last few years is also hurting identification. While the team struggles, the Rays have to rely on the experience at the stadium to attract fans, and Tropicana Field will lose to Amalie Arena, Raymond James Stadium, and often Bright House Field in regards to experience. Tropicana Field isn't a place where memories are made unless the team is winning.

After the 2015 season, Noah Pransky of Shadow of the Stadium posted a chart passed on from reader Patrice Derome. The chart, from a sports marketing text, is the
"'psychological continuum model' that ultimately affects how often fans attend games and how much of their income they're willing to spend on a team".


The psychological continuum model and the Sports Spectator Identification Scale match well. Lowly Identified would be the Awareness Stage, Moderately Identified would be the Attraction and Attachment Stage, and Highly Identified would be the Allegiance Stage.

Pransky asks if the Rays have enough people in the Allegiance Stage. I would ask if there is enough incentive in Tampa Bay for fans to be in the Allegiance Stage and Highly Identified with the Rays.

This is more than Facebook likes or Twitter follows. It is more than watching on TV or choosing the Rays in the phone call public polling survey. These are fans that live and die with every pitch. Without those kind of fans, there might only be 10 more years of pitches left in Tropicana Field.

Wednesday, November 9, 2016

2016 Bradenton Marauders Attendance Review

Welcome to our fifth attendance review of 2016 and our seventh attendance review of the Bradenton Marauders. This post continues our series of looking back at trends in Tampa Bay area fan behavior since 2007. Today we look at the home attendance of the 2016 Bradenton Marauders.

Overview: The Bradenton Marauders began play in the Florida State League in 2010. The Marauders play their home games at McKechnie Field. McKechnie Field is also the spring training home of the Pittsburgh Pirates. In 2013, the population of Bradenton was 51,763.

Bradenton Marauders 2016:

Home Games: 67

Total attendance: 87,149 (down 15.32% from 2015: 102,913)


Per Game Average: 1,340 (down 10.13% from 2015: 1,491)


Highest attended game: 5,923 on Saturday, April 9th vs Fort Myers

Lowest attended game: 456 on Tuesday, August 31st vs Jupiter

Double headers: 2 (May 27, Aug 28)

Cancellations: 1


Average time of game: 2 hours, 41 minutes

Notable rehab assignments: Justin Masterson

Other notable appearances: None
Breakdown:

(red highlight = below annual average of 1,340)

Overall:


Marauders Top 10 Attended Games:


By Month:


The following graph depicts the average attendance by month.


By Day of the Week:


Marauders attendance increased 40% on the weekends compared to their average Monday through Thursday attendance.
  • Mon-Thurs average attendance: 820
  • Fri-Sun average attendance: 2,028
  • Increase: 40%

The following graph depicts the average attendance by day.


The following chart shows how often each day outdrew the game prior.


By Opponent:


By Starting Pitcher:


The following chart depicts how attendance varied from one starter to the next. If a pitcher is a great draw, the percentage between he and the prior starter should be higher.


Additional Bradenton Marauders Reviews:

Attendance Review: 2015 Bradenton Marauders
Attendance Review: 2014 Bradenton Marauders
Attendance Review: 2013 Bradenton Marauders
Attendance Review: 2012 Bradenton Marauders
Attendance Review: 2011 Bradenton Marauders
Attendance Review: 2010 Bradenton Marauders