Next week, we will look at each Minor League team individually.
Overall Tampa Bay Baseball Market
In 2016, the Tampa Bay baseball market drew 2,128,040. This was a decrease of 0.85% (18,202 fans) from 2015's total attendance of 2,146,242. Since 2005, the Tampa Bay Baseball Market has drawn 27,982,200 fans.

The following graph depicts the previous chart.

Rays Attendance since 2005
I've mentioned before that Rays attendance increased in 2016 by 3%. The Rays totaled 1,286,163 fans in 2016. Since 2005, the Rays have totaled 18,004,319, an average of 1,636,756.

The following graph depicts the previous chart.

Since 2005, the Rays have accounted for 64% of baseball tickets sold in Tampa Bay. In 2016, they accounted for 60%, a 2% increase over 2015, but 11% lower than 2009 and 2010 ticket sales.

The following graph depicts the previous chart.

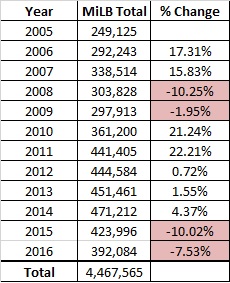
Tampa Bay Minor League Attendance 2005-2016
Since 2005, Minor League Baseball in Tampa Bay has drawn 4,467,565. In 2016, total Minor League attendance decreased 7.5% or 31,912 tickets. This is the second year in a row Minor League attendance in Tampa Bay has decreased. As mentioned, individual team analysis by year will be posted next week.
The following graph depicts the previous chart.

Tampa Bay Spring Training 2005-2016
I covered regional Spring Training in depth earlier this year but just to reiterate, regional Spring Training decreased 5% in 2016 to 449,793.

The following graph depicts the previous chart.
