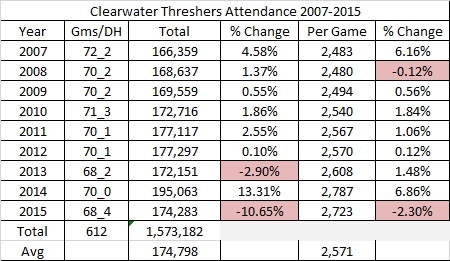
First, a look at the Threshers average annual and per game attendance from 2007-2015. From 2007-2015, the Threshers average annual attendance was 174,798. The Threshers per game average in the 612 games at Bright House Field from 2007 to 2015 was 2,571.
Average attendance 2007-2015 chart. (DH = Double headers. Attendance is only counted for the second game.)
Average attendance 2007-2015 graph:

Next, we will look at the Threshers average attendance by month from 2007 to 2015 as well as their best and worst average attended months.

The following graph depicts the Threshers average attendance per month.

This chart shows the annual attendance ranking by month each year spanning from 2007 to 2015 as well as the month’s average finish.
(Yellow highlights = Best month/ Red highlights = Worst month)

The next few charts depict average attendance per month per year from 2007 to 2015.
April average per game attendance 2007 to 2015:

May average per game attendance 2007 to 2015:

June average per game attendance 2007 to 2015:

July average per game attendance 2007 to 2015:

August average per game attendance 2007 to 2015:

Analysis:
Threshers average per game attendance has steadily increased since 2007. Many of their best months since 2007 have come in the last two years. That could be because of better marketing, beginning post-game concerts, or perhaps lack of fan interest in going to Tropicana Field.
Looking by month, the growth of attendance in April is an interesting phenomenon. This might be due to good weather in the Florida spring or due to promotions such as the 6,000+ fans who came out to a Star Wars Night on April 18, 2015.
Good nighttime weather might also be the reason the Threshers do well in attendance in May. The May high in 2009 is very interesting, as that was the season after the Rays miracle season and an increase in Rays awareness.
June is the Threshers worst average month. This might be because the Florida nights are getting warmer and more humid in June and occasional rain showers are beginning. Another factor could be that there typically aren't many great promotions in June. Surprisingly, we don't see a bump from May to June due to parents taking out-of-school kids to the ballpark.
July is the Threshers best month for average attendance. This is probably heavily due to their annual July 4th fireworks extravaganza. We've proven before that people love fireworks.
August/September attendance might be affected by two factors that will be worth exploring: correlation with the Rays in the pennant race and the weather. Oddly, the Threshers worst August was a year the Rays did not make the playoffs and their best August was a year the Rays did. So perhaps their is no correlation. Or perhaps Augusts with lower attendance correlate with rainier Augusts. I will have to research rainfall to determine accuracy of that theory.
The Threshers are the highest drawing Minor League team in the Tampa Bay area. Their attendance is far higher than many of the other teams. Looking at when people attend their games show us quite a bit about the patterns of baseball attendance in Clearwater, and Tampa Bay as a whole.