Tuesday, April 1, 2014

Tampa Bay Baseball Attendance - March 31, 2014

Tampa Bay baseball attendance for March 31, 2014:

Tampa Bay Rays:
  • Team Home Game #: 1
  • Attendance: 31,042 (sell out)
  • % of Capacity: 100%
  • Starting Pitcher: David Price
  • Opponent's Starting Pitcher: R.A. Dickey
  • Avg Attendance to Date: 31,042
  • Avg Attendance vs Opponent: 31,042
  • Avg Attendance per Day of the Week: 31,042
  • Avg Attendance for Starting Pitcher: 31,042
  • Promotions (if any): Opening Day
  • Other Factors (traffic accidents, conflicting events, etc): None

No other area games.

Monday, March 31, 2014

Former Tampa Mayor writes brief history of Tropicana Field


In the March 30th issue of the Tampa Tribune, former Tampa mayor Pam Iorio wrote a brief but informative history of Tropicana Field. I learned a lot I didn't know.

For example, at first the following sites were considered:
  • Gandy Boulevard east of 4th Street

  • the Carillon Parkway area

  • the Sod Farm –an area fronting Interstate 275
What drove Pinellas County to finally select the eventual spot was that they wanted to beat Hillsborough County to a baseball stadium, so St. Petersburg would get Major League Baseball and Tampa wouldn't.

But the biggest eye-opener in the article was a quote by former Pinellas County Commissioner Bob Stewart:
Looking back, Stewart says the ultimate site selection really had more to do with urban redevelopment than what was the best location for baseball fans.
Not where the stadium could draw the most fans, but where politicians hoped the urban area would start or continue to grow.

With 30 years of hindsight and hindsight being 20/20, this is really bad logic. A product should be placed with its consumers in mind, not in the hope that other businesses and their consumers will show up around it. But that's politics.

We are trying to stay away from the Great Stadium Debate on this site. Other sites have done and continue to do great work in that area. As a former boss once told me, "love what is". In other words, work with the hand you are dealt with.

Kudos to Pam Iorio for giving us a quick history lesson on where our cards came from.

Opening Day - Our Daily Posts

Today is Opening Day. Baseball is back and everything is wonderful again. Being a new site, I wanted to let folks know what to expect here throughout the season.

Here is what I intend on tracking daily for each team in the Tampa Bay area.
  • Team Home Game #:

  • Attendance:

  • Starting Pitcher:

  • Opponent's Starting Pitcher:

  • Avg Attendance to Date:

  • Avg Attendance vs Opponent:

  • Avg Attendance per day of the week:

  • Avg Attendance for Starting Pitcher:

  • Promotions (if any):

  • Other Factors (traffic accidents, conflicting events, etc):
Starting on April 1, we will track the Rays; on April 4th we add the Dunedin Blue Jays, and on April 5th we add the Tampa Yankees and Clearwater Threshers. So by the end of the week, we will be tracking attendance for all five teams. Meanwhile, we will still be posting examinations and analysis on past seasons and past trends.

It should be a fun season. Thanks for reading.

Saturday, March 29, 2014

Rays give Opening Day babies Opening Day tickets for life

In a very interesting promotion, the Tampa Bay Rays are giving all babies born in Bayfront Place in St. Petersburg on March 31 - the day of the Rays Opening Day - a 4-person pass for all Tampa Bay Rays home openers for the rest of their lives.

According to the Tampa Bay Business Journal:
Each child born at Bayfront Baby Place in St. Petersburg on the Rays’ opening day will receive a certificate for four tickets to all future Rays home openers. They will also receive a gift package delivered by the Rays’ mascot Raymond and Rays players. Later in the year the infants and parents will be recognized during an on-field ceremony.

This leads to some very interesting questions:

1) What if the family or the baby moves? Is the coupon transferable? Can someone else use it ever?

2) Not wishing harm on anyone, but what if a baby doesn't live that long? Some coupons are then worth more than others.

3) What is the coupon's value over time? What are the tax repercussions? As a gift, I'm sure the Rays are writing it off, but do the families have to claim it on their taxes? A gift like that, close to $100 a year every year, could value over $100,000 for a lifetime. Ticket prices don't go down. Or does it not have any value because it might not be sellable?

4) What is the process the family must follow to claim future Opening Day tickets? Do they have to call the ticket office months in advance to "reserve" the guaranteed tickets?

The promotion is definitely getting the Rays some good buzz. Of course, I am always curious about the details.

Friday, March 28, 2014

Forbes rates Rays as least valuable MLB franchise

At only $485 million dollars.

Earlier this week, Forbes released their annual Major League Baseball franchise valuations. Once again, the New York Yankees, with a value of nearly $2.5 billion, were determined the most valuable franchise in baseball. The Rays were 30th with a value of $485 million.

While the average team increased in value by 9%, the value of the Rays increased 8%. That's 1% behind the Yankees, 19% below the Giants, and tied with the Angels and Rangers. The value of the Astros fell the most at -15%. The value of the Rays' Florida neighbors, the Marlins, fell by 4%.

Another interesting point in the Forbes article is that "Even after kicking in $95 million towards the league’s 34% local revenue sharing pool and their $64 million PILOT bond payments for Yankee Stadium last season", the Yankees revenue is almost as much as the Rays franchise value ($461 million - or 95% of $485 million). That means the Yankees make almost enough to buy the Rays every year. The benefits of playing in New York City and a metro area of 19.9 million, compared to the Tampa Bay metro area of 2.8 million.

But Forbes did rank the Rays as "The Best MLB Team for the Money". That is the result of good management and wise spending.

On the subject of management, as Cork Gaines at Rays Index points out, the value of the Rays has gone up 132% since Stu Sternberg took over in 2006. Not a bad investment. That's 18.86% a year. Comparatively, on Sept 30th, 2005, just before Stu Sternberg became principal owner of the Rays, the S&P index was at 1,228. Today, it is at 1,861. That's only a 51.5% increase. Stu Sternberg has made 80% more by owning the Rays than if he only invested in the S&P 500. Of course, Stu Sternberg probably has more investments than just the Rays, but his investment in the team is doing very, very well.

Thursday, March 27, 2014

Attendance Review: 2008 Tampa Yankees

Welcome to our second attendance review post on the Tampa Yankees, minor league affiliate of the New York Yankees.

Background:

The Tampa Yankees began play in 1994. After two seasons playing at the University of South Florida, the Tampa Yankees moved to Legends Field, a stadium built across the street from Raymond James Stadium, home of the NFL's Tampa Bay Buccaneers. Legends Field was renamed Steinbrenner Field in 2008.

Tampa Yankees 2008:


Home Games: 69

Total attendance: 86,870 (down 29.84% from 2007: 123,829)

Average: 1,472.37 (down from 2007: 1,848.19)

Highest attended game: 5,216 on Saturday, May 31st vs Fort Myers Miracle

Lowest attended game: 636 on Thursday, August 7th vs Fort Myers Miracle

Low point of average attendance: April 23, Game 10 (1123.10)

Double headers: 9 (June 17, June 23, July 10, July 22, July 26, August 3, August 15, August 22, August 24)

Cancellations: 1 (July 9 vs St Lucie)

Notable rehab assignments: Hideki Matsui (August 15, 16)

Other notable appearances: None

Breakdown:
(red highlight = below annual average of 1,472)

By Month:


The following graph depicts the average attendance by month.


By Day:


The following graph depicts the average attendance by day of the week.


By opponent:


By Starting Pitcher:


By Promotion:


Attendance data derived from Tampa Yankees schedule page. Promotion information found on Tampa Yankees archived pages.

Tuesday, March 25, 2014

Attendance Review: 2007 Tampa Yankees

Welcome to our first attendance review post on the Tampa Yankees, minor league affiliate of the New York Yankees.

Background:

The Tampa Yankees began play in 1994. After two seasons playing at the University of South Florida, the Tampa Yankees moved to Legends Field, a stadium built across the street from Raymond James Stadium, home of the NFL's Tampa Bay Buccaneers. Legends Field was renamed Steinbrenner Field in 2008.

Our attendance review begins in 2007.

Tampa Yankees 2007:


Home Games: 70

Total attendance: 123,829

Average: 1,848.19

Highest attended game: 10,257 - Friday, May 18th vs Fort Myers. (Roger Clemens rehab start)

Lowest attended game: 706 on April 17 vs Clearwater.

Low point of average attendance: April 17, Game 4 (856.50)

Double headers: 2 (July 17, August 3)

Cancellations: 1 (May 8 vs Daytona)

Notable rehab assignments: Roger Clemens (May 18), Chien-Ming Wang (April 19).

Other notable appearances: Kei Igawa debut (May 19)

Breakdown:
(red highlights = below annual average of 1,848)

By Month:


The following graph depicts the average attendance by month.


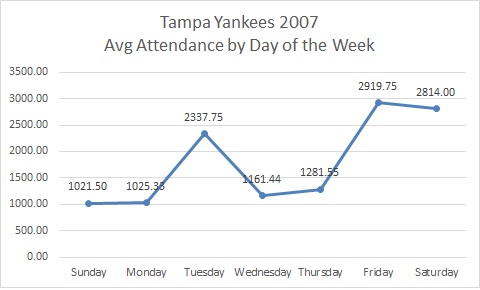
By Day:


The following graph depicts the average attendance by day.


By Opponent:


By Starting Pitcher:


Saturday, March 22, 2014

Tampa Bay Rays Attendance Analysis: vs American League Opponents by Day

Welcome to our 12th analysis post on Tampa Bay Rays attendance from 2007-2013. This post examines the Rays home attendance versus American League opponents by day. We will show average attendance against each American League team that has visited Tropicana Field by day of the week. We will then show the percentage of attendance increase or decrease for those games over or below the per game average attendance for that day from 2007 to 2013.

This chart shows by day Tampa Bay Rays home attendance trends versus American League East opponents (click to enlarge).


The "Overall" column is the overall attendance against all opponents for that particular day from 2007-2013. "vs Team X" is the average attendance against that particular team from 2007 to 2013. "Team X +/-%" is the percentage of change attendance versus the opponent is above or below the overall average. Against the AL East, of 28 possible scheduling opportunities, 17 had positive changes in attendance and 11 had negative changes in attendance.

The following graph depicts the Tampa Bay Rays home attendance trends versus American League East opponents.


Notice the wide variance between attendance per opponent. On Mondays, games versus the Yankees and Red Sox have drawn more than double what games versus the Blue Jays have drawn. Tuesday games versus the Yankees have also nearly drawn double Tuesday games versus the Blue Jays. Games versus Baltimore is only AL East Friday scenario that does not average 20,000 fans. Saturday is only day games versus the Red Sox outdraw games versus the Yankees.

Now for a look at the Tampa Bay Rays home attendance versus AL Central opponents (click to enlarge).


Of the 35 possible scenarios, 13 had positive outcomes and 22 had negative outcomes. Games scheduled versus the Kansas City Royals and Chicago White Sox only have above-average attendance on Saturdays, an outcome shared by every team in the division. The Cleveland Indians and Minnesota Twins had the most above-average days with four.

The following graph depicts the Tampa Bay Rays home attendance trends versus American League Central opponents.


Variance in attendance for AL Central opponents is far more narrow than it is for AL East opponents. Friday is exceptionally narrow with the average attendance ranging from 18.8K in games versus the Royals to 20.5K in games versus the Tigers. The widest difference is on Wednesday, when an average game against the Royals draws less than 13K and an average game versus the Indians draws over 21K. That is a nearly 8,500 difference in attendance for the average game versus these opponents.

Now for a look at the Tampa Bay Rays home attendance versus AL West opponents (click to enlarge).


Not good.

Of 28 possible scenarios, only one, Sunday games versus the Texas Rangers, averages above the overall average Sunday attendance (24811.5 > 24360.92), and even then only by 1.85%. Average attendance against the Oakland A's and Seattle Mariners has been especially bad.

The Rays front office can take solace in the fact that many of these are small samples. In many cases, the "average" attendance is drawn from one or two games. For example, the Rays have only played one Monday game versus the Mariners since 2007. That game, played on April 30th, 2012, drew 9,458 fans.

The following graph depicts the Tampa Bay Rays home attendance trends versus American League West opponents.


This graph also better depicts an unusual-looking spike in attendance against Seattle (purple line) on Tuesdays. We can explain that. The Rays have played five Tuesday games against the Mariners since 2007. In 2008, the Rays opened the season against the Mariners. Opening Day that year drew 36,048 fans to Tropicana Field. Excluding that game, the Rays average Tuesday attendance since 2007 versus the Seattle Mariners is 11,258.5, which is 34.7% lower than the 2007-2013 Tuesday average.

But Opening Day is a real factor in attendance. The Rays have to open the season against someone every year. Since 2007, they have often opened against AL East teams, which lowers the effect of the sell-out with other games throughout the season.

Overall, of the 91 possible scenarios - the Rays could play any team on any day - the Rays have positive attendance outcomes in 31. To the Rays advantage, of those 31, 17 outcomes are against the AL East, which comprises a majority of the Rays annual schedule.

The Rays also have 9 to 12 games versus National League opponents during the season. Attendance in those games varies greatly on opponent. However, since the Rays don't play those opponents often, it is not prudent to examine those games as closely as we do games versus annual opponents. In 2014, for example, the Rays will play the Pirates and Brewers at Tropicana Field. Neither of these opponents have visited St. Petersburg in last seven years.

Hence, we can keep analysis on attendance versus National League opponents to a comparison to the annual average, as we did here.

We are almost to the point were we can make some judgements on the Rays 2014 attendance and see where it compares to the previous seven-year trend. We are not yet to the point of making a prediction, but we may be able to judge soon.

Sunday, March 16, 2014

Tampa Bay Rays Attendance Analysis: vs National League Opponents 2007-2013

Welcome to our 11th second-level analysis post on Tampa Bay Rays attendance from 2007-2013. This post examines the Rays home attendance versus National League opponents. We will show attendance against each National League team that has visited Tropicana Field. We will then show the percentage of attendance increase or decrease those games had over or below the per game average attendance for all during that particular year.

For a look at Rays attendance trends versus AL East teams, click here. For a look at Rays attendance trends versus AL Central teams, click here. For a look at Rays attendance versus AL West teams, click here.

Note: Houston Astros data is for 2008 only. 2013 games vs the Houston Astros are included in the AL West attendance review.

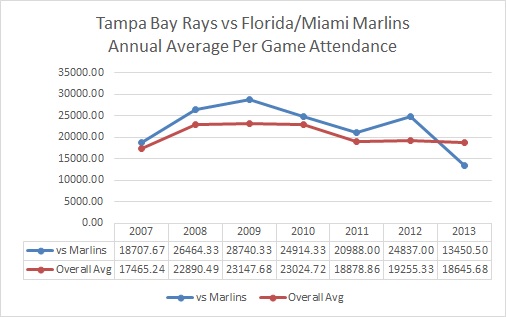
The following chart looks at Rays average home attendance in games against the Florida/Miami Marlins. We are looking at the Marlins separately as the Rays play the Marlins every year.


The following graph shows the annual per game average versus the Florida/Miami Marlins compared to the Rays overall annual per game average.


The following chart looks at Rays average home attendance in games against each National League opponent from 2007-2013.


The following chart looks at Rays average home attendance in games against all National League teams each year and compares games versus NL opponents to the Rays average home attendance for that particular year.


Note: This chart does not include the Florida/Miami Marlins.

The following graph shows the annual per game average versus National League opponents compared to the Rays overall annual per game average.


Saturday, March 15, 2014

Tampa Bay Rays Attendance Analysis: vs AL West Opponents 2007-2013

Welcome to our 10th second-level analysis post on Tampa Bay Rays attendance from 2007-2013. This post examines home attendance versus AL West opponents. We will show attendance against the Astros, Angels, A's, Mariners, and Rangers. We will then show the percentage increase or decrease attendance playing these teams has over the average attendance for that particular year.

Note: Houston Astros data is for 2013 only. Previous games vs the Houston Astros is included in the National League attendance review.

For a look at Rays attendance trends vs AL East teams, click here. For a look at Rays attendance trends vs AL Central teams, click here.

(For an examination of Rays attendance by month, click here. For an examination of Rays attendance by day of the week, click here. For an examination of attendance by starting pitcher, click here. For an examination of attendance by promotions, click here. For a look at Rays attendance during winning streaks, click here. And for a look at Rays attendance for post-game concerts, click here.)

The following chart looks at Rays home average attendance in games against the Houston Astros (2013 only).


The following chart looks at Rays home average attendance in games against the Los Angeles Angels of Anaheim.


The following graph shows the annual per game average vs the Los Angeles Angels of Anaheim compared to the Rays overall annual per game average.


The following chart looks at Rays home average attendance in games against the Oakland A's.


The following graph shows the annual per game average versus the Oakland A's compared to the Rays overall annual per game average.


The following chart looks at Rays home average attendance in games against the Seattle Mariners.


Note: The Rays 2008 home opener was against the Seattle Mariners. This game was a sell-out and probably would have been no matter the opponent.

The following graph shows the annual per game average versus the Seattle Mariners compared to the Rays overall annual per game average.


The following chart looks at Rays home average attendance in games against the Texas Rangers.


Note: The Rays played three games versus the Texas Rangers at Disney's Wide World of Sports in 2007.

The following graph shows the annual per game average versus the Texas Rangers compared to the Rays overall annual per game average.