Wednesday, February 19, 2014

Tampa Bay Rays Attendance Analysis: Per Starting Pitcher 2007-2013 PART 2

Welcome to our 4th second-level analysis post on Tampa Bay Rays attendance from 2007-2013 and our second on attendance by starting pitcher. This post continues the examination of attendance per Tampa Bay Rays starting pitcher started here.

(Note: This post will look at October games, but only as they pertain to the regular season. Postseason games will be examined at a later date.)

(For an examination of Rays attendance by month, click here. For an examination of Rays attendance by day of the week, click here.)

Our first chart lists pitchers who started at least 10 games for the Rays from 2007 to 2013. Listed are games started, the average attendance during that pitcher's starts, the Rays overall average attendance while the pitcher was on the team and in the rotation, and percentage difference between the pitcher's average attendance and the Rays average attendance during that span.


(Note: This chart does not include Wade Davis's 2012 season as a relief pitcher. Only his 2009-2011 seasons as a starting pitcher are included.)

The following are a few breakouts of individual starting pitchers and how they compared to the Rays annual attendance averages.

Here is a breakout of average attendance during games started by David Price, the Rays annual average for that season, and percentage difference, followed by a graphic depiction.


Graph:


Here is a breakout of average attendance during games started by James Shields, the Rays annual average for that season, and percentage difference, followed by a graphic depiction.


Graph:


Here is a breakout of average attendance during games started by Jeff Neimann, the Rays annual average for that season, and percentage difference, followed by a graphic depiction.


(Note: Neimann only started two games in 2008.)


Here is a breakout of average attendance during games started by Jeremy Hellickson, the Rays annual average for that season, and percentage difference, followed by a graphic depiction.


(Note: Hellickson only started two games in 2010.)


Tuesday, February 18, 2014

Tampa Bay Rays Attendance Analysis: Per Starting Pitcher 2007-2013

Welcome to our 3rd second-level analysis post on Tampa Bay Rays attendance from 2007-2013. This post examines the Rays attendance by starting pitcher. This post will look at October games, but only as they pertain to the regular season. Postseason games will be examined at a later date.

As mentioned in the previous posts, the Rays average annual attendance from 2007-2013 was 1,640,983. This includes only games at Tropicana Field. The Rays played 3 games at Disney's Wide World of Sports in both 2007 and 2008. The Rays per game average in the 561 games at Tropicana Field from 2007 to 2013 was 20,475.72.

(For an examination of Rays attendance by month, click here. For an examination of Rays attendance by day of the week, click here.)

Our first chart lists pitchers who started at least 10 games for the Rays from 2007 to 2013. Listed are games started, the Rays win-loss record in those games, the average attendance during that pitcher's starts, and the percentage difference between the pitcher's average attendance and the Rays 2007-2013 average attendance.


(Not listed: Jason Hammel (7 starts), Casey Fossum (6 starts), JP Howell (4 starts), Jae Seo (4 starts), Jake Odorizzi (2 starts), Alexander Colome (1 start), and Enny Romero (1 start).)

This chart ranks each starting pitcher by annual average attendance per year. Only pitchers with 10 or more starts are ranked. A grey box indicates the pitcher made 0 starts or was not on the team. An empty box means the pitcher started games, but did not make 10 or more starts.


The highlighted 1s indicates the average attendance was highest for that pitcher.

The following charts depict average attendance trends for Rays starting pitchers who had three or more years of 10 starts or more. This list includes James Shields (100), David Price (70), Jeremy Hellickson (50), Matt Garza (47), Jeff Neimann (43), and Scott Kazmir (43).

This excludes Edwin Jackson, Wade Davis, Matt Moore, Chris Archer, Andy Sonnanstine, Roberto Hernandez, and Alex Cobb.

James Shields attendance trend 2007-2012.

James Shields overall average attendance: 21,061.87.


David Price attendance trend 2009-2013.

David Price overall average attendance: 21,904.96.


Jeremy Hellickson attendance trend 2011-2013.

Jeremy Hellickson overall average attendance: 18,804.80


Matt Garza attendance trend 2008-2010.

Matt Garza overall average attendance: 23,750.62


Jeff Neimann attendance trend 2008-2012.

Jeff Neimann overall average attendance: 18,985.35


Scott Kazmir attendance trend 2007-2009.

Scott Kazmir overall average attendance: 22,563


Monday, February 17, 2014

Tampa Bay Rays Attendance Analysis 2007-2013: Days of the Week

Welcome to our 2nd second-level analysis post on Tampa Bay Rays attendance from 2007-2013. This post examines the Rays attendance by day of the week. This post will look at October games, but only as they pertain to the regular season. Postseason games will be examined at a later date.

As mentioned in the previous post, the Rays average annual attendance from 2007-2013 was 1,640,983. This includes only games at Tropicana Field. The Rays played 3 games at Disney's Wide World of Sports in both 2007 and 2008. The Rays per game average in the 561 games at Tropicana Field from 2007 to 2013 was 20,475.72.

(For an examination of Rays attendance by month, click here.)

This first chart depicts the average number of games played on each respective day, per day attendance average at Tropicana Field from 2007 to 2013, and the percentage difference each day is from the Rays overall 2007-2013 average.


This chart depicts the annual ranking of the days of the week based on their average attendance for each respective year. Notice the day with the worst average attendance (7s) has been a different day each year for the last four years. Also, only in 2008 was Friday not 3rd in average attendance. As well, only in 2012 was Saturday not first in daily average attendance.


The below chart depicts the average Monday attendance from 2007 to 2013. Overall Monday average: 16,999.


The below chart depicts the average Tuesday attendance from 2007 to 2013. Overall Tuesday average: 17,238.


The below chart depicts the average Wednesday attendance from 2007 to 2013. Overall Wednesday average: 17,566.


The below chart depicts the average Thursday attendance from 2007 to 2013. Overall Thursday average: 17,782.


The below chart depicts the average Friday attendance from 2007 to 2013. Overall Friday average: 20,168.


The below chart depicts the average Saturday attendance from 2007 to 2013. Overall Saturday average: 26,892.


The below chart depicts the average Sunday attendance from 2007 to 2013. Overall Sunday average: 24,361.


Sunday, February 16, 2014

Tampa Bay Rays Attendance Analysis 2007-2013: By Month

Welcome to our 1st second-level analysis post on Tampa Bay Rays attendance from 2007-2013. This post examines the Rays attendance by month. This post will look at October games, but only as they pertain to the regular season. Postseason games will be examined at a later date.

First, a look at the Rays average annual attendance from 2007-2013 as well as the per game attendance from 2007-2013. From 2007-2013, the Rays average annual attendance was 1,640,983. This includes only games at Tropicana Field. The Rays played 3 games at Disney's Wide World of Sports in both 2007 and 2008. The Rays per game average in the 561 games at Tropicana Field from 2007 to 2013 was 20,476.

(Red highlights = Below Average)


This chart shows the average number of games played each month from 2007-2013, the overall monthly average during that span, and the year that month was closest to the average.

(Red highlights = Below 2007-2013 average game attendance of 20,476)


This chart again shows the average number of games and the overall monthly average from 2007-2013, but also shows the year that month was furthest from the average.

(Red highlights = Below 2007-2013 average game attendance of 20,475.72)


This chart shows the annual attendance ranking by month each year spanning from 2007 to 2013 as well as the month's average finish.

(Yellow highlights = Best month/ Red highlights = Worst month)


Here are charts depicting how attendance at each month has varied in the years spanning from 2007 to 2013.

April average attendance from 2007 to 2013. April average: 21,618.78.


May average attendance from 2007 to 2013. May average: 18,302.40


June average attendance from 2007-2013. June average: 20,288.97


July average attendance from 2007-2013. July average: 23,175.24


August average attendance from 2007-2013. August average: 20,440.44


September average attendance from 2007-2013. September average: 20,996.66


Thursday, February 13, 2014

Attendance Review: 2013 Tampa Bay Rays

This is the seventh of a series of attendance reviews we will do on this site. Today we will look at the home attendance of the 2013 Tampa Bay Rays.

Total attendance: 1,510,300

Per Game Average: 18,465.68

Highest attended games: 3 x 34,078 (Opening Day 4/2 vs BAL, 8/4 vs SFG, 8/25 vs NYY.)

Lowest attended game: 9,952 on Mon, May 6 vs TOR.

Lowest point of average attendance: June 25, Game 39 (17,592.21)

Breakdown:
(yellow highlights = below annual average of 18,465.68)

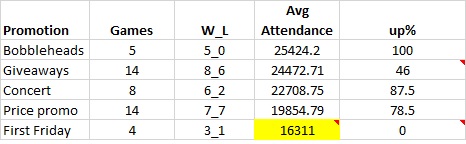
(Up % = Percentage of games where attendance for that variable was higher than the previous game at Tropicana Field. For example, if Monday attendance was 18,000 and Tuesday was 18,001, Tuesday = up. Also, if 10,000 fans attended a Jeremy Hellickson game and 15,000 fans attended a David Price game the next day, Price = up. Opening Day is neither up nor down.)

By Month:


By Day of the Week:


By Opponent:


By Starting Pitcher:


By Promotion:


Day Game / Night Game Splits:


Tuesday, February 11, 2014

Attendance Review: 2012 Tampa Bay Rays

This is the sixth of a series of attendance reviews we will do on this site. Today we will look at the home attendance of the 2012 Tampa Bay Rays.

Total attendance: 1,559,682

Per Game Average: 19,255.33

Highest attended games: 2 x 34,078 (Opening Day 4/6 vs NYY, 4/7 vs NYY.)

Lowest attended game: 9,458 on Mon, April 30 vs SEA.

Lowest point of average attendance: May 21, Game 22 (19,163.15)
Breakdown:

(yellow highlights = below annual average of 19,255.33)

(Up % = Percentage of games where attendance for that variable was higher than the previous game at Tropicana Field. For example, if Monday attendance was 18,000 and Tuesday was 18,001, Tuesday = up. Also, if 10,000 fans attended a James Shields game and 15,000 fans attended a David Price game the next day, Price = up. Opening Day is neither up nor down.)

By Month:


By Day of the Week:


By Opponent:


By Starting Pitcher:


By Promotion:


Day Game / Night Game Splits:


(Note: Day weekdays include Opening Day, July 4th, and Labor Day games.)

Sunday, February 9, 2014

Attendance Review: 2011 Tampa Bay Rays

This is the fifth of a series of attendance reviews we will do on this site. Today we will look at the home attendance of the 2011 Tampa Bay Rays.

Total attendance: 1,529,188

Average: 18,878.86

Highest attended games: Opening Day 4/1 vs BAL (34,078). (Only other game over 30,000: 32,487 on Sat, July 16 vs BOS.)

Lowest attended game: 10,042 on Thurs, April 14 vs MIN.

Low point of average attendance: May 5, Game 19 (16,311.68)
Breakdown:

(yellow highlights = below annual average of 18,878.86)

(Up % = Percentage of games where attendance for that variable was higher than the previous game at Tropicana Field. For example, if Monday attendance was 18,000 and Tuesday was 18,001, Tuesday = up. Also, if 10,000 fans attended a James Shields game and 15,000 fans attended a David Price game the next day, Price = up. Opening Day is neither up nor down.)

By Month:


By Day of the Week:


By Opponent:


By Starting Pitcher:


By Promotion:


Day Game/ Night Game Splits: