Total attendance: 1,510,300
Per Game Average: 18,465.68
Highest attended games: 3 x 34,078 (Opening Day 4/2 vs BAL, 8/4 vs SFG, 8/25 vs NYY.)
Lowest attended game: 9,952 on Mon, May 6 vs TOR.
Lowest point of average attendance: June 25, Game 39 (17,592.21)
Breakdown:
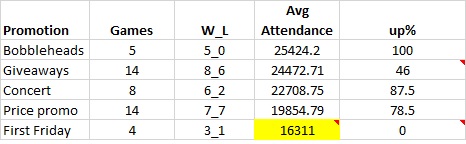
(yellow highlights = below annual average of 18,465.68)
(Up % = Percentage of games where attendance for that variable was higher than the previous game at Tropicana Field. For example, if Monday attendance was 18,000 and Tuesday was 18,001, Tuesday = up. Also, if 10,000 fans attended a Jeremy Hellickson game and 15,000 fans attended a David Price game the next day, Price = up. Opening Day is neither up nor down.)
By Month:

By Day of the Week:

By Opponent:

By Starting Pitcher:

By Promotion:
Day Game / Night Game Splits:
