Welcome to our 2nd second-level analysis post on Tampa Bay Rays attendance from 2007-2013. This post examines the Rays attendance by day of the week. This post will look at October games, but only as they pertain to the regular season. Postseason games will be examined at a later date.
As mentioned in the previous post, the Rays average annual attendance from 2007-2013 was 1,640,983. This includes only games at Tropicana Field. The Rays played 3 games at Disney's Wide World of Sports in both 2007 and 2008. The Rays per game average in the 561 games at Tropicana Field from 2007 to 2013 was 20,475.72.
(For an examination of Rays attendance by month, click here.)
This first chart depicts the average number of games played on each respective day, per day attendance average at Tropicana Field from 2007 to 2013, and the percentage difference each day is from the Rays overall 2007-2013 average.
This chart depicts the annual ranking of the days of the week based on their average attendance for each respective year. Notice the day with the worst average attendance (7s) has been a different day each year for the last four years. Also, only in 2008 was Friday not 3rd in average attendance. As well, only in 2012 was Saturday not first in daily average attendance.
The below chart depicts the average Monday attendance from 2007 to 2013. Overall Monday average: 16,999.
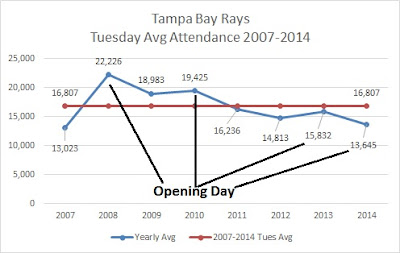
The below chart depicts the average Tuesday attendance from 2007 to 2013. Overall Tuesday average: 17,238.
The below chart depicts the average Wednesday attendance from 2007 to 2013. Overall Wednesday average: 17,566.
The below chart depicts the average Thursday attendance from 2007 to 2013. Overall Thursday average: 17,782.
The below chart depicts the average Friday attendance from 2007 to 2013. Overall Friday average: 20,168.
The below chart depicts the average Saturday attendance from 2007 to 2013. Overall Saturday average: 26,892.
The below chart depicts the average Sunday attendance from 2007 to 2013. Overall Sunday average: 24,361.


