This is the first of a series of attendance reviews we will do on this site. We are going to start with 2007, the last year of the Devil Rays era, the second year of new Rays (then-Devil Rays) ownership, the second year of Joe Maddon’s managerial tenure, and the last year the Devil Rays lost over 90 games.
Background:
From 1998-2006, the Devil Rays drew 12,617,125 fans to Tropicana Field. This excludes the 110,000 fans the Devil Rays and Yankees drew to the two “home” games played in the Tokyo Dome in 2004. During this nine-year span, the Devil Rays averaged 1,401,903 fans per season at Tropicana Field. The highest attended year was the inaugural year of 1998 (2,506,903) and the lowest was 2003 (1,058,695). The dismal 2003 attendance was 24.5% less than the 1998-2006 average and 42% of the 1998 total.
I feel safe starting this series of attendance reviews in 2007 for two primary reasons:
1) In 2007, 1,360,676 fans attended games at Tropicana Field. This excludes three games played at Disney’s Wide World of Sports (26,927 fans). The 2007 Tropicana Field attendance is 97.1% of the 1998-2006 average. Close enough to not have to go back any further. Besides the inaugural attendance number, there are no outliers in attendance.
2) The Devil Rays record in 2007 was 66-96, nearly identical to their average 1998-2006 record of 65-97. Again, close enough to not have to back any further. There are no outliers in the win-loss record. The only other exploration I could do would be how attendance varies among 90-100 loss teams. I don’t believe that’s worth exploring at the present moment.
Now that we have laid the Namoli-era foundation, we can explore attendance during the Stu Sternberg and Matt Silverman era. We begin in 2007.
(Again, these numbers exclude “home” games played at the Disney Wide World of Sports from May 15-17, 2007.)
(Up % = Percentage of games where attendance for that variable was higher than the previous game at Tropicana Field. For example, if Monday attendance was 18,000 and Tuesday was 18,001, Tuesday = up. Also, if 10,000 fans attended a Casey Fossum game and 15,000 fans attended a Scott Kazmir game the next day, Kazmir = up. Opening Day is neither up nor down.)
Total attendance: 1,386,229
Average: 17,465.24
Highest attended game: Opening Day (38,437). 3 x 36,048 (July 14, 15 vs New York; July 28 vs Boston)
Lowest attended game: 8,440 on May 23 vs Seattle.
Low point of average attendance: June 13, Game 35 (14,439.66)

By Month:

By Day:

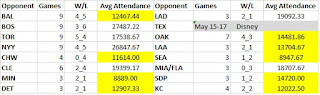
By Opponent:
By Starting Pitcher:

By Promotion:

Day Game/Night Game Splits:


(Note: All 2007 Sunday games were day games. All 2007 Saturday games were night games.)
Total Win/Loss "Up %":

Background:
From 1998-2006, the Devil Rays drew 12,617,125 fans to Tropicana Field. This excludes the 110,000 fans the Devil Rays and Yankees drew to the two “home” games played in the Tokyo Dome in 2004. During this nine-year span, the Devil Rays averaged 1,401,903 fans per season at Tropicana Field. The highest attended year was the inaugural year of 1998 (2,506,903) and the lowest was 2003 (1,058,695). The dismal 2003 attendance was 24.5% less than the 1998-2006 average and 42% of the 1998 total.
I feel safe starting this series of attendance reviews in 2007 for two primary reasons:
1) In 2007, 1,360,676 fans attended games at Tropicana Field. This excludes three games played at Disney’s Wide World of Sports (26,927 fans). The 2007 Tropicana Field attendance is 97.1% of the 1998-2006 average. Close enough to not have to go back any further. Besides the inaugural attendance number, there are no outliers in attendance.
2) The Devil Rays record in 2007 was 66-96, nearly identical to their average 1998-2006 record of 65-97. Again, close enough to not have to back any further. There are no outliers in the win-loss record. The only other exploration I could do would be how attendance varies among 90-100 loss teams. I don’t believe that’s worth exploring at the present moment.
Now that we have laid the Namoli-era foundation, we can explore attendance during the Stu Sternberg and Matt Silverman era. We begin in 2007.
(Again, these numbers exclude “home” games played at the Disney Wide World of Sports from May 15-17, 2007.)
(Up % = Percentage of games where attendance for that variable was higher than the previous game at Tropicana Field. For example, if Monday attendance was 18,000 and Tuesday was 18,001, Tuesday = up. Also, if 10,000 fans attended a Casey Fossum game and 15,000 fans attended a Scott Kazmir game the next day, Kazmir = up. Opening Day is neither up nor down.)
Total attendance: 1,386,229
Average: 17,465.24
Highest attended game: Opening Day (38,437). 3 x 36,048 (July 14, 15 vs New York; July 28 vs Boston)
Lowest attended game: 8,440 on May 23 vs Seattle.
Low point of average attendance: June 13, Game 35 (14,439.66)
Breakdown:
(yellow highlights = below annual average of 17,465.24)

By Month:

By Day:

By Opponent:

By Starting Pitcher:

By Promotion:

Day Game/Night Game Splits:

(Note: All 2007 Sunday games were day games. All 2007 Saturday games were night games.)
Total Win/Loss "Up %":
